
StocksXray: free stock research for every S&P 500 stock and 59 more markets
Markets today
Prices, fair value and an X-Ray Score for every S&P 500 stock, from SEC filings. Updated after each close.
Latest news

US stocks finish lower as energy shares lead and communication services shares lag
Thursday 12 November: the S&P 500 slipped 0.4% to 7,592.40, the Nasdaq Composite −0.4% and the Dow −0.4%.
Markets

Asian stocks end higher; KOSPI surges 4.4%
Markets
Alphabet stock plunges 12.3% as search sales disappoint
StocksGOOG$295.35 ▲ 1.62%
48X-Ray

Norwegian Cruise Line stock soars 13.4% on third quarter results
StocksNCLH$18.06 ▼ 4.04%
44X-Ray
Markets
All market news
Wall Street rallies: S&P 500 +2.3% as tech shares lead
Monday 9 November: the S&P 500 rallied 2.3% to 7,549.94, the Nasdaq Composite +2.7% and the Dow +2.2%.
Markets
Nikkei 225 jumps 2.3% as Asian stocks end mixed; KOSPI declines 0.8%
Markets
US stocks finish higher as tech shares rally, but more stocks fall than rise
MarketsStocks
All stock news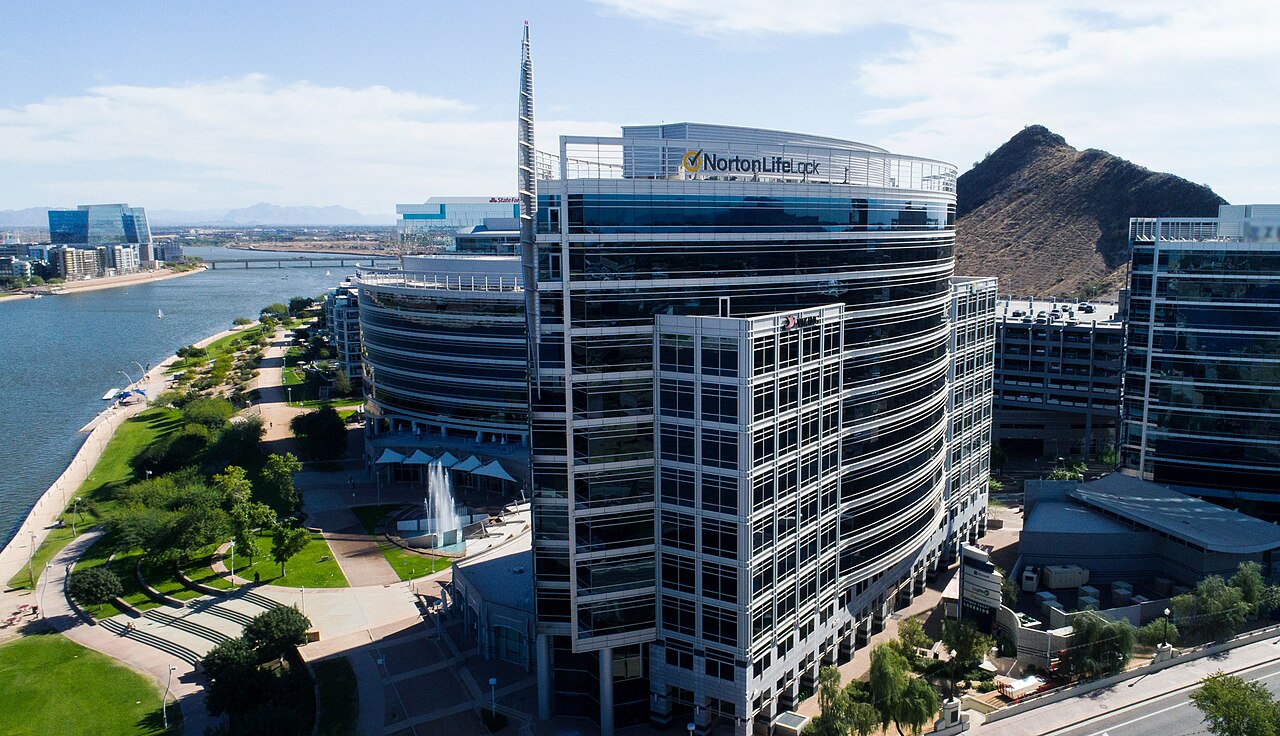
Gen Digital stock soars 15.8% after beat and raise
Gen Digital closed at $28.20, still 10.9% below its 52-week high, on volume 1.4 times the recent average.
StocksGEN$29.69 ▼ 3.08%
58X-Ray

Fortinet stock plunges 20.1% after third quarter earnings
StocksFTNT$129.54 ▲ 1.12%
62X-Ray

ServiceNow stock plunges 26.9% after earnings as bookings slow
StocksNOW$100.66 ▼ 2.04%
50X-Ray
Economy and rates
All economyCommodities
All commoditiesWheat fell 2.1% and corn fell 0.9% this week
CommoditiesWheat fell 2.8% and corn fell 1.9% this week
CommoditiesWorld indices
All indicesMore data and tools
Most undervalued by fair value
All undervalued stocks →Highest X-Ray Scores
Undervalued and high quality →World markets
All 60 exchanges →Latest SEC filings
Markets we cover
All 60 exchanges →UKLondon Stock Exchange · 3,818 stocksXLONChinaShenzhen Stock Exchange · 2,824 stocksXSHEHong KongHong Kong Stock Exchange · 2,679 stocksXHKGChinaShanghai Stock Exchange · 2,284 stocksXSHGAustraliaAustralian Securities Exchange · 1,850 stocksXASXKoreaKOSDAQ · 1,843 stocksXKOSCanadaTSX Venture Exchange · 1,525 stocksXTSXBrazilB3 Stock Exchange · 1,464 stocksBVMFThailandStock Exchange of Thailand · 1,408 stocksXBKKTaiwanTaiwan Stock Exchange · 1,101 stocksXTAITaiwanTaipei Exchange · 1,097 stocksROCOMalaysiaBursa Malaysia · 1,066 stocksXKLSKoreaKorea Exchange · 938 stocksXKRXIndonesiaIndonesia Stock Exchange · 923 stocksXIDXSwedenNasdaq Stockholm · 923 stocksXSTOCanadaToronto Stock Exchange · 875 stocksXTSEPakistanPakistan Stock Exchange (PSX) · 768 stocksXKARGermanyDeutsche Börse Xetra · 710 stocksXETRFranceEuronext Paris · 627 stocksXPARPolandWarsaw Stock Exchange · 583 stocksXWARVietnamHo Chi Minh and Hanoi stock exchanges · 572 stocksXSTCMexicoBolsa Mexicana de Valores · 363 stocksXMEXCanadaCanadian Securities Exchange · 362 stocksXCNQNorwayOslo Børs · 297 stocksXOSLEgyptEgyptian Exchange · 276 stocksXCAIRussiaMoscow Exchange · 250 stocksXMOSPhilippinesPhilippine Stock Exchange · 244 stocksXPHSSouth AfricaJohannesburg Stock Exchange · 243 stocksXJSESpainMadrid Stock Exchange · 238 stocksXMADSwitzerlandSIX Swiss Exchange · 227 stocksXSWXFinlandNasdaq Helsinki · 192 stocksXHELDenmarkNasdaq Copenhagen · 180 stocksXCSECanadaCboe Canada · 171 stocksNEOENigeriaNigerian Exchange Group · 159 stocksXNSAArgentinaBolsas y Mercados Argentinos · 154 stocksXBUEGreeceAthens Stock Exchange · 143 stocksXATHRomaniaBucharest Stock Exchange · 129 stocksXBSEChileSantiago Stock Exchange · 114 stocksXSGOBelgiumEuronext Brussels · 113 stocksXBRUNetherlandsEuronext Amsterdam · 109 stocksXAMSMauritiusStock Exchange of Mauritius · 93 stocksXMAUAustriaVienna Stock Exchange · 84 stocksXWBOMoroccoCasablanca Stock Exchange · 74 stocksXCASKenyaNairobi Securities Exchange · 69 stocksXNAICroatiaZagreb Stock Exchange · 54 stocksXZAGCzech RepublicPrague Stock Exchange · 45 stocksXPRAHungaryBudapest Stock Exchange · 42 stocksXBUDBotswanaBotswana Stock Exchange · 41 stocksXBOTZimbabweZimbabwe Stock Exchange · 40 stocksXZIMGhanaGhana Stock Exchange · 39 stocksXGHAPortugalEuronext Lisbon · 37 stocksXLISPeruLima Stock Exchange · 35 stocksXLIMTanzaniaDar es Salaam Stock Exchange · 28 stocksXDARZambiaLusaka Securities Exchange · 26 stocksXLUSIrelandEuronext Dublin · 21 stocksXDUBUgandaUganda Securities Exchange · 18 stocksXUGAMalawiMalawi Stock Exchange · 17 stocksXMSWRwandaRwanda Stock Exchange · 10 stocksXRSELuxembourgLuxembourg Stock Exchange · 5 stocksXLUXSri LankaColombo Stock Exchange · 3 stocksXCOLAll 60 exchangesSee the full list →
Why StocksXray
One score, five lenses
Valuation, growth, profitability, financial health and dividends, each ranked against the stock's sector and combined into the X-Ray Score.A fair value range
The average of up to 15 valuation models, shown as a range together with how far the models disagree. It is a comparison with models, not a price target.Plain-English facts
Every stock page explains its numbers in simple words, and the Financial knowledge series has 142 lessons.Featuring 484 US stocks across 11 sectors
Explore all sector outlooks →How the X-Ray Score reads
How StocksXray is different
Read the method →Five lenses, one score
The X-Ray Score blends valuation, growth, profitability, financial health and dividends, each ranked against the stock's own sector.Fair value from up to 15 models
Each fair value is the average of the models that pass our checks, and the range shows how far apart they are.Public data, named sources
SEC EDGAR filings, licensed market prices and Damodaran Online datasets. Every page says where its numbers come from.Updated after each close
Prices and scores refresh after every market close (US data as of 12 Nov 2026).484 US stocks scored across 60 markets
- 484US stocks with an X-Ray Score
- 60markets with prices and signals
- 63world indices tracked
- 142lessons in the Financial knowledge series