








TD Bank Dividend and Earnings: History, Dates, Yield and Payout
The Toronto-Dominion Bank (TD) pays a quarterly dividend of C$1.12 per common share, a rate it set in May 2026 and first paid on 31 July 2026. At that rate the dividend comes to C$4.48 a year. TD declares each dividend with its quarterly results, pays it at the end of January, April, July and October, and since December 2025 has reviewed the amount twice a year instead of once. This guide covers the dates, the record since 2016, the yield, the payout ratio and the earnings behind it.
All amounts are in Canadian dollars unless stated. TD's fiscal year ends on 31 October, so "fiscal 2026" runs from November 2025 to October 2026.
Key takeaways
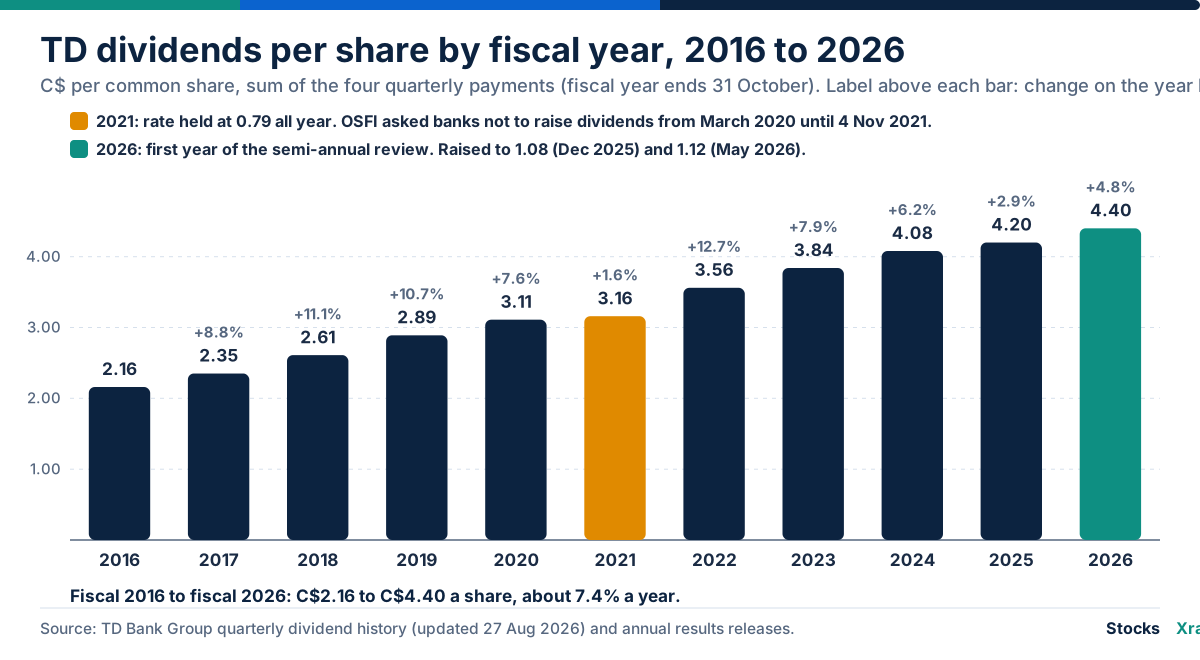
- TD paid C$4.40 per share in fiscal 2026, up 4.8% from C$4.20 in fiscal 2025 and roughly double the C$2.16 of fiscal 2016, a rise of about 7.4% a year.
- The latest dividend, C$1.12, was paid on 31 October 2026 to shareholders of record on 9 October 2026, which was also the ex-dividend date. As of 14 November 2026 the next dividend has not been declared; TD's investor-relations calendar lists its fourth-quarter conference call for 3 December 2026.
- On 4 December 2025 TD moved from an annual to a semi-annual dividend review. It raised the dividend at both reviews so far: to C$1.08 in December 2025 and to C$1.12 in May 2026.
- TD lists a dividend payout ratio of 40% to 50% among its medium-term targets. In fiscal 2025 the payout was 50.0% of adjusted earnings and 36.2% of reported earnings, which were swollen by a C$8.6 billion gain on selling its stake in Charles Schwab.
- On the 13 November 2026 close of C$176.42, the dividends paid over the past 12 months gave a yield of 2.49%, down from 5.33% at the end of 2024, because the share price rose far faster than the dividend.
What TD does and how it makes money
TD had total assets of C$2,094.6 billion at 31 October 2025 and more than 28.1 million clients, according to its 2025 annual report. Like other banks, it earns money from the gap between what it charges on loans and what it pays on deposits, and from fees from wealth management, insurance, cards and capital-markets work. It reports in four business segments and a Corporate segment:
- Canadian Personal and Commercial Banking: chequing and savings accounts, mortgages, cards and business banking for about 16 million clients in Canada.
- U.S. Retail (called U.S. Banking in fiscal 2026 releases): personal, business and wealth products for more than 10 million US customers.
- Wealth Management and Insurance: investing, advice and insurance for more than 6 million Canadian customers, plus institutional asset management.
- Wholesale Banking: TD Securities and TD Cowen, serving corporate, government and institutional clients in markets and investment banking.
- Corporate: treasury, balance sheet management and other enterprise items.
| Segment | Net income, nine months to 31 July 2026 (C$ millions) | Share of the four segments |
|---|---|---|
| Canadian Personal and Commercial Banking | 6,064 | 45.5% |
| U.S. Banking | 2,927 | 21.9% |
| Wealth Management and Insurance | 2,435 | 18.3% |
| Wholesale Banking | 1,916 | 14.4% |
| Corporate | -433 | n/a |
| Total reported net income | 12,909 |
The segment figures are the reported totals from TD's results releases for the first, second and third quarters of fiscal 2026, added together. Canadian Personal and Commercial Banking alone provides almost half of segment profit, which is why Canadian interest rates, mortgage renewals and household credit matter so much to TD's earnings.
Until February 2025 TD also owned 10.1% of Charles Schwab, the US brokerage. It completed the sale of all 184.7 million of its Schwab shares on 12 February 2025, and the net gain of C$8.6 billion went through its fiscal 2025 results. That single item is the main reason reported profit was so far above adjusted profit that year.
TD Bank earnings: five years of results
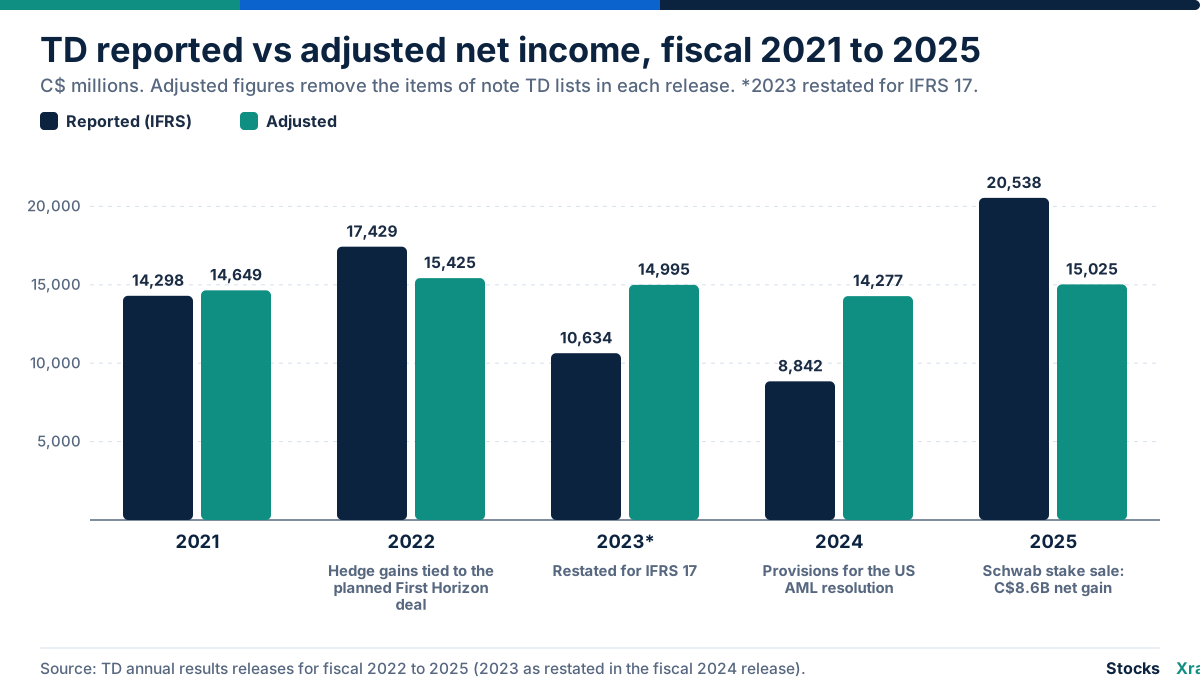
TD reports two sets of numbers. Reported results follow International Financial Reporting Standards (IFRS). Adjusted results remove "items of note", one-off gains and charges the bank lists in each release. The difference has been unusually large in recent years, so it pays to read both.
| Fiscal year | Reported net income (C$ m) | Adjusted net income (C$ m) | Reported diluted EPS | Adjusted diluted EPS | Dividends per share |
|---|---|---|---|---|---|
| 2021 | 14,298 | 14,649 | 7.72 | 7.91 | 3.16 |
| 2022 | 17,429 | 15,425 | 9.47 | 8.36 | 3.56 |
| 2023 (restated) | 10,634 | 14,995 | 5.52 | 7.91 | 3.84 |
| 2024 | 8,842 | 14,277 | 4.72 | 7.81 | 4.08 |
| 2025 | 20,538 | 15,025 | 11.56 | 8.37 | 4.20 |
Fiscal 2023 is shown as restated in the 2024 release for IFRS 17, the new insurance accounting standard; as first reported it was C$10,782 million reported and C$15,143 million adjusted. EPS means earnings per share; our guide to basic and diluted EPS explains the difference.
What moved the reported line:
- Fiscal 2022: reported profit included gains on interest-rate hedges tied to TD's planned purchase of the US bank First Horizon, a deal that was later terminated.
- Fiscal 2024: TD provisioned for the global resolution of US investigations into its anti-money-laundering (AML) controls under the Bank Secrecy Act. The total payment was US$3.088 billion (C$4.233 billion), announced on 10 October 2024. Reported profit fell to C$8,842 million while adjusted profit was C$14,277 million.
- Fiscal 2025: the Schwab sale lifted reported profit to C$20,538 million. Adjusted profit rose 5% to C$15,025 million and adjusted EPS rose from C$7.81 to C$8.37.
Over the five years, adjusted EPS moved in a narrow band between C$7.81 and C$8.37 while the dividend rose every year from C$3.16 to C$4.20. That is the background to the slower increases declared in December 2024 and December 2025.
The latest four quarters
| Quarter | Reported net income (C$ m) | Adjusted net income (C$ m) | Reported diluted EPS | Adjusted diluted EPS | CET1 ratio |
|---|---|---|---|---|---|
| Q4 2025 (to 31 Oct 2025) | 3,280 | 3,905 | 1.82 | 2.18 | 14.7% |
| Q1 2026 (to 31 Jan 2026) | 4,043 | 4,216 | 2.34 | 2.44 | 14.5% |
| Q2 2026 (to 30 Apr 2026) | 4,251 | 4,168 | 2.43 | 2.38 | 14.3% |
| Q3 2026 (to 31 Jul 2026) | 4,615 | 4,671 | 2.74 | 2.77 | 14.3% |
In the first nine months of fiscal 2026, adjusted EPS was C$7.59, up 22.6% from C$6.19 a year earlier. Reported EPS was C$7.50 against C$9.72, because the earlier period contained the Schwab gain. In the third quarter Wholesale Banking net income rose 87% on a reported basis, Wealth Management and Insurance rose 20%, and provisions for credit losses, the money set aside for loans that may go bad, fell to C$917 million from C$971 million. TD's adjusted return on equity was 16.0% in that quarter; our guide to return on equity explains the measure.
TD's investor-relations calendar, checked on 14 November 2026, lists the fourth-quarter 2026 conference call for 3 December 2026 at 9:30 a.m. Eastern time. The full-year fiscal 2026 results and the next dividend declaration normally come with that report.
TD Bank dividend history
The table adds up the four quarterly payments in each fiscal year, using TD's own dividend history. The first payment of each fiscal year is made on or near 31 January and the last on 31 October.
| Fiscal year | Quarterly amounts paid (C$) | Total per share (C$) | Change |
|---|---|---|---|
| 2016 | 0.51, then 0.55 three times | 2.16 | |
| 2017 | 0.55, then 0.60 three times | 2.35 | +8.8% |
| 2018 | 0.60, then 0.67 three times | 2.61 | +11.1% |
| 2019 | 0.67, then 0.74 three times | 2.89 | +10.7% |
| 2020 | 0.74, then 0.79 three times | 3.11 | +7.6% |
| 2021 | 0.79 four times | 3.16 | +1.6% |
| 2022 | 0.89 four times | 3.56 | +12.7% |
| 2023 | 0.96 four times | 3.84 | +7.9% |
| 2024 | 1.02 four times | 4.08 | +6.2% |
| 2025 | 1.05 four times | 4.20 | +2.9% |
| 2026 | 1.08 twice, then 1.12 twice | 4.40 | +4.8% |
Three patterns stand out.
The freeze of 2020 to 2021. In March 2020 Canada's bank regulator, the Office of the Superintendent of Financial Institutions (OSFI), told the banks it regulates not to raise dividends. It lifted that expectation on 4 November 2021. TD's quarterly rate stayed at C$0.79 for seven payments, from April 2020 to October 2021, and the first increase after the freeze, declared on 2 December 2021, was the largest in the table: 12.7%, to C$0.89.
Slower increases in 2024 and 2025. The increases declared on 5 December 2024 (C$1.02 to C$1.05) and 4 December 2025 (C$1.05 to C$1.08) were each 2.9%, the smallest in a decade outside the freeze. They came in the years of the AML settlement and the remediation that followed. The May 2026 increase to C$1.12 was 3.7%.
No cuts in the record. TD's table of quarterly payments starts in 1987. The per-share amount was held flat at times, for example at C$0.61 for ten payments from October 2008 to January 2011, but it was never reduced. The three drops visible in the raw figures, in 1989, 1999 and 2014, came from one-for-one stock dividends that doubled the number of shares and halved the payment per share. To compare an amount from before 31 January 2014 with today's, divide it by two.
TD dividend dates and how a payment works
TD's board declares the dividend on the day it reports quarterly results, usually in late February, late May, late August and late November or early December. The release names three dates:
- Record date: you must be on the shareholder register at the close of this day to be paid.
- Ex-dividend date: the first day the shares trade without the right to the payment. Since Canadian markets moved to one-day settlement on 27 May 2024, the ex-dividend date is the same day as the record date, so you need to buy by the trading day before it.
- Payment date: TD pays on and after the last day of January, April, July and October.
Our guide to ex-dividend and record dates explains the mechanics in more detail.
| Declared | Ex-dividend and record date | Paid | Amount (C$) |
|---|---|---|---|
| 4 Dec 2025 | 9 Jan 2026 | 31 Jan 2026 | 1.08 |
| 26 Feb 2026 | 9 Apr 2026 | 30 Apr 2026 | 1.08 |
| 28 May 2026 | 10 Jul 2026 | 31 Jul 2026 | 1.12 |
| 27 Aug 2026 | 9 Oct 2026 | 31 Oct 2026 | 1.12 |
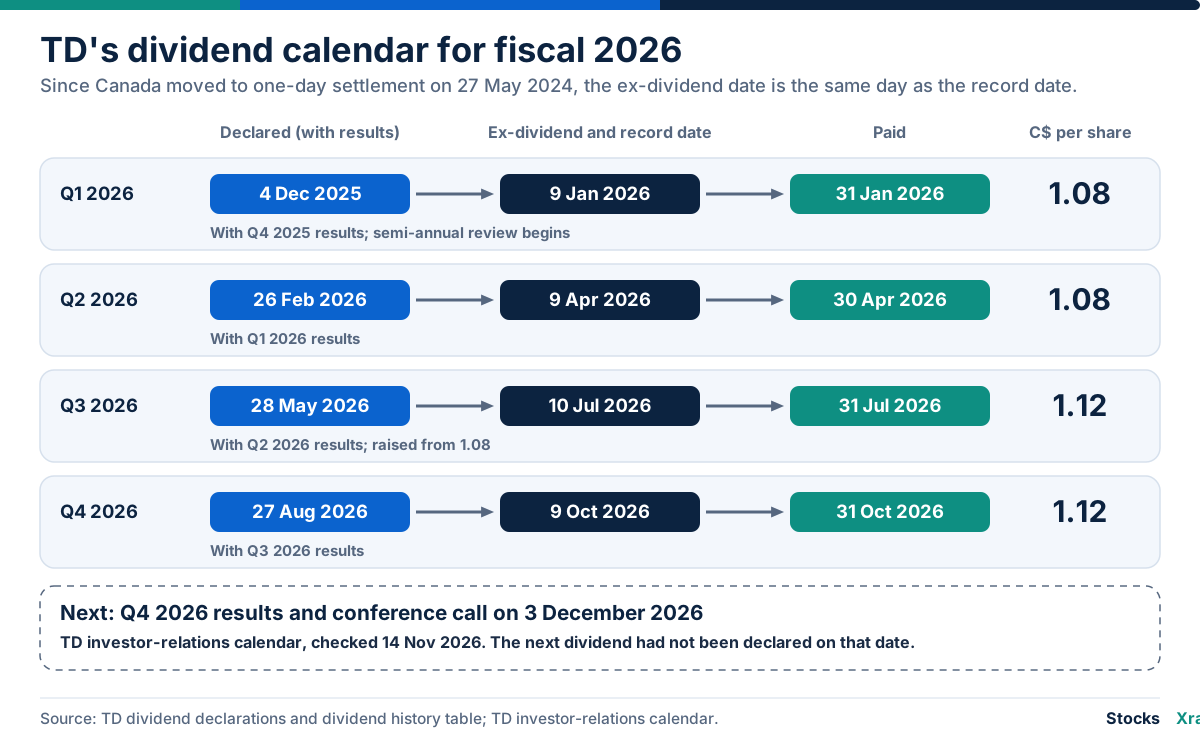
The pattern of the last decade is that the dividend declared with fourth-quarter results is paid at the end of January. Upcoming ex-dividend dates for TD and other stocks appear on our dividend calendar once companies announce them.
Worked example (calculation from the dates above). An investor who bought 100 TD shares by 8 October 2026 was on the register on 9 October and received 100 times C$1.12, or C$112, on 31 October 2026. Someone who held 100 shares through all of fiscal 2026 received C$440. A holder who lives outside Canada would normally see Canadian withholding tax of 25% deducted at source, which a tax treaty can reduce; at the full 25% rate the C$112 would arrive as C$84 (illustrative). TD designates its dividends as "eligible dividends" for Canadian tax purposes unless it says otherwise. The value in another currency depends on the exchange rate on the payment date; our CAD to USD converter shows the current rate.
The semi-annual dividend review
On 4 December 2025 TD said it had moved from an annual dividend review cycle to a semi-annual one, to keep shareholder returns in line with earnings growth. It still pays four times a year. What changed is how often the board considers an increase: the two reviews so far have come with fourth-quarter results in December and second-quarter results in May.
Twice-yearly increases are not new for TD. Before 2014 it often raised the dividend twice in one year. In fiscal 2012, for example, the quarterly rate went from C$0.68 to C$0.72 in March and to C$0.77 in August (amounts before the 2014 stock dividend). From 2015 to 2020 the increases came once a year with first-quarter results in late February or early March, and from December 2021 to December 2025 once a year with fourth-quarter results.
A review is not a promise. TD has not said what it will declare on 3 December 2026, and past increases say nothing certain about future ones.
TD's dividend payout ratio
The payout ratio is the share of earnings paid out as dividends. TD lists a dividend payout ratio of 40% to 50% among its medium-term targets, set out in its fiscal 2025 results. Its own figures:
| Fiscal year | Payout ratio, adjusted earnings | Payout ratio, reported earnings |
|---|---|---|
| 2024 | 52.1% | 86.1% |
| 2025 | 50.0% | 36.2% |
The two columns show why the choice of earnings matters. In fiscal 2024 the AML provisions cut reported profit, so the reported payout looked stretched; in fiscal 2025 the Schwab gain inflated reported profit, so the reported payout looked low. On adjusted earnings the ratio was at or just above the top of TD's range. In the first nine months of fiscal 2026, dividends of C$3.28 per share against adjusted EPS of C$7.59 give a payout of about 43% (our calculation), back in the middle of the range because adjusted EPS grew faster than the dividend. Our dividend payout ratio guide explains how to read the measure.
TD Bank dividend yield
Dividend yield is the dividend divided by the share price. Our stock pages use the dividends paid over the past 12 months, by ex-dividend date, divided by the latest close. On that basis TD's yield was 2.49% on 13 November 2026, from C$4.40 of dividends and a close of C$176.42. On the current quarterly rate of C$1.12, or C$4.48 a year, the figure is about 2.54%.
| Date | Close (C$) | Dividends in the calendar year to that date (C$) | Yield |
|---|---|---|---|
| End of 2021 | 96.98 | 3.16 | 3.26% |
| End of 2022 | 87.67 | 3.56 | 4.06% |
| End of 2023 | 85.62 | 3.84 | 4.48% |
| End of 2024 | 76.53 | 4.08 | 5.33% |
| End of 2025 | 129.36 | 4.20 | 3.25% |
| 13 Nov 2026 | 176.42 | 4.40 (past 12 months) | 2.49% |
The yield more than halved between the end of 2024 and November 2026 while the dividend went up. From the end of 2024 to 13 November 2026 the annual dividend rose 7.8%, from C$4.08 to C$4.40, and the share price rose 130.5%, from C$76.53 to C$176.42. A falling yield on a rising dividend means the price has outrun the payout, not that the payout has shrunk. Our dividend yield guide covers this and the opposite trap, a high yield caused by a falling price. For other dividend payers, see our best dividend stocks list.
Capital, balance sheet and the US asset cap
Free cash flow, the usual test of whether a company can afford its dividend, does not work well for a bank, because lending and deposit-taking are its operating business. Investors look at capital instead. The key figure is the Common Equity Tier 1 (CET1) ratio: the bank's core shareholders' equity as a share of its risk-weighted assets. The higher it is, the bigger the cushion against losses and the more room for dividends and buybacks.
TD's CET1 ratio was 13.1% at the end of fiscal 2024, 14.7% at the end of fiscal 2025 after the Schwab sale, and 14.3% at 31 July 2026. TD set a CET1 ratio of 13% or higher among its targets for fiscal 2026. The bank has also been buying back shares: the number outstanding fell from 1,722.5 million at 30 April 2025 to 1,652.1 million at 30 April 2026, which spreads profit and dividends over fewer shares. Our post on share buybacks explains when that helps owners.
The main constraint is in the United States. As part of the October 2024 AML resolution, the Office of the Comptroller of the Currency capped the average combined total assets of TD's two US banking subsidiaries at US$434 billion, their level on 30 September 2024. TD's 2025 annual report says it cut those assets by more than 10% from that level, leaving headroom of about US$52 billion, and that the US banks held US$382 billion at 31 October 2025. In August 2026 TD said it expected AML remediation and related investment to cost about US$550 million before tax in fiscal 2026, with remediation work continuing into calendar 2027. The cap limits how much the US business can grow until regulators are satisfied.
How StocksXray scores TD
On the 13 November 2026 close, TD's Market X-Ray score on our TD stock page was 85 out of 100, ranking 6th of 870 stocks on the Toronto Stock Exchange, with high confidence. The five lenses were:
| Lens | Score (13 Nov 2026) | What it reflects |
|---|---|---|
| Trend | 87 | Price above its long-term averages and near its 52-week high |
| Momentum | 81 | Returns over 3, 6 and 12 months against other TSX stocks |
| Stability | 95 | Low volatility and a shallow worst drawdown over one year |
| Liquidity | 100 | Average daily trading value of about C$956 million |
| Income | 43 | A dividend yield of 2.5%, small next to other TSX payers |
The Market X-Ray is price-based: it describes how the shares have traded against other stocks on the same exchange, not how healthy or cheap the bank is. The fundamental lenses described in our five lenses guide are not yet available for Canadian stocks. How the score is built is explained in how the X-Ray score works. For the current price, the interactive TD chart and a printable TD research report are on the stock page.
Risks TD lists in its annual report
TD's 2025 annual report names more than 20 risk factors that could make results differ from expectations. Six bear most directly on the dividend:
- Geopolitical, trade and tariff risk, including the effect of new or retaliatory tariffs on borrowers in Canada and the United States.
- Inflation, interest rates and recession uncertainty, which drive loan demand, lending margins and credit losses.
- AML remediation and regulatory compliance: the US Bank Secrecy Act program and TD's enterprise-wide AML program, plus regulatory oversight in general.
- Technology, cyber security and third parties, including cyber attacks, data breaches, fraud and failures by suppliers that handle client information.
- Execution risk: delivering on strategy, acquisitions and disposals, and the insured deposit account agreement with Charles Schwab, which continues after the share sale.
- Competition from other banks and from new entrants, including fintechs and large technology companies.
Our financials sector guide covers how these risks affect banks generally.
Common mistakes when reading TD's dividend
- Comparing old amounts directly. Payments before 31 January 2014 are per pre-stock-dividend share; divide them by two.
- Reading "semi-annual" as the payment schedule. TD pays quarterly. Only the review is twice a year.
- Using the reported payout ratio in an unusual year. In 2024 and 2025 one-off items pushed the reported ratio to 86.1% and 36.2%. The adjusted ratio was 52.1% and 50.0%.
- Using the old ex-dividend rule. Before 27 May 2024 the ex-dividend date was one business day before the record date. It is now the same day.
- Treating a lower yield as a lower dividend. TD's yield fell while its dividend rose; the price did the work.
Frequently asked questions
How much is the TD Bank dividend? TD pays C$1.12 per common share each quarter, or C$4.48 a year at that rate. The rate took effect with the 31 July 2026 payment and was paid again on 31 October 2026. Total dividends for fiscal 2026 were C$4.40 per share because the first two payments were C$1.08.
When does TD Bank pay its dividend? TD pays four times a year, on and after the last day of January, April, July and October. Each dividend is declared with quarterly results about two months before the payment date. As of 14 November 2026, the next dividend has not been declared.
What is the TD Bank ex-dividend date? The most recent ex-dividend date was 9 October 2026, the same day as the record date, for the C$1.12 dividend paid on 31 October 2026. Since May 2024 Canadian ex-dividend dates fall on the record date, so a buyer must purchase by the previous trading day. TD's next ex-dividend date will be set when the board declares the next dividend.
What is TD Bank's dividend yield? On 13 November 2026, TD's dividends over the past 12 months of C$4.40 and its close of C$176.42 gave a yield of 2.49%. On the current annual rate of C$4.48 the yield was about 2.54%. The yield changes every day with the share price.
Does TD Bank pay a semi-annual dividend? No. TD pays a dividend every quarter. Since 4 December 2025 it reviews the amount twice a year, and it raised it at both reviews so far, to C$1.08 in December 2025 and to C$1.12 in May 2026.
How often has TD increased its dividend? TD raised its quarterly dividend in every fiscal year from 2016 to 2026 except 2021, when Canada's bank regulator had asked banks not to raise dividends. The per-share amount has never been cut in TD's own record back to 1987, once its three stock dividends are taken into account.
When is TD Bank's next earnings report? As of 14 November 2026, TD's investor-relations calendar lists its fourth-quarter 2026 conference call for 3 December 2026 at 9:30 a.m. Eastern time. That report covers the full fiscal year to 31 October 2026, and TD normally declares its next dividend the same day.
Sources and data notes
- TD Bank Group, quarterly dividend history, table updated 27 August 2026.
- TD Bank Group newsroom: dividend declarations of 4 December 2025, 26 February 2026, 28 May 2026 and 27 August 2026; results releases for the first, second and third quarters of 2026.
- TD annual results releases and 2025 annual report filed with the SEC: fiscal 2025, 2025 annual report MD&A, fiscal 2024, fiscal 2023, fiscal 2022.
- TD, closing of the sale of Schwab stock, 12 February 2025; TD investor-relations events calendar, checked 14 November 2026.
- OSFI, statement lifting the expectations on dividends and buybacks, 4 November 2021; Toronto Stock Exchange, T+1 trading notice; Canada Revenue Agency, rates for Part XIII tax.
- Share prices, yields and Market X-Ray scores are StocksXray's own end-of-day records for the Toronto Stock Exchange, as of the 13 November 2026 close.
This page covers TD's common-share dividend and results to the third quarter of fiscal 2026. It does not cover preferred-share dividends, the dividend reinvestment plan, exchange-traded funds that hold TD, or individual tax advice.
Educational information, not financial advice.
Related reading
Educational only, not financial advice. Examples use illustrative numbers.