









Enbridge Dividend: History, Dates, Yield and Why Growth Slowed
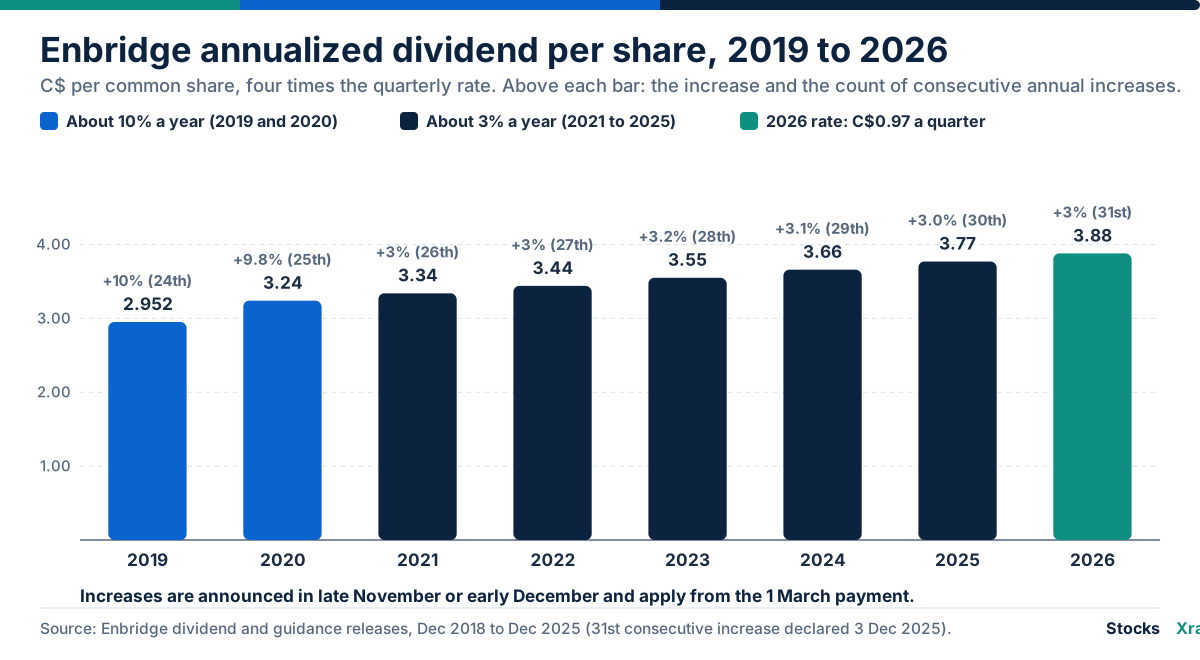
Enbridge Inc. (ENB) pays a quarterly dividend of C$0.97 per common share in 2026, or C$3.88 a year, on the first day of March, June, September and December. The latest dividend goes to shareholders of record on 13 November 2026 and is paid on 1 December 2026. The 3% increase for 2026 was Enbridge's 31st annual raise in a row, but every raise since 2021 has been about 3%, against about 10% in 2019 and 2020. This guide covers the dates, the history, the yield, the payout and the cash flow behind it.
Enbridge reports in Canadian dollars, and all amounts here are in Canadian dollars unless stated.
Key takeaways
- The 2026 dividend is C$0.97 a quarter (C$3.88 a year), up 3% from C$0.9425. Enbridge declared it on 3 December 2025 as its 31st consecutive annual increase.
- The 1 December 2026 payment goes to holders of record on 13 November 2026, which is also the ex-dividend date. The 2026 record dates were 17 February, 15 May, 14 August and 13 November.
- Growth slowed from 10% in 2019 and 9.8% in 2020 to about 3% a year from 2021 to 2026. Enbridge targets a payout of 60% to 70% of distributable cash flow (DCF) and ties dividend growth to growth in DCF per share, which rose about 3.6% a year from 2021 to 2025.
- In 2025 the dividend of C$3.77 was 66% of DCF per share of C$5.71 (our calculation from Enbridge's figures). Measured against earnings per share, it was more than 100%, which is why Enbridge points investors to cash flow instead.
- On the 13 November 2026 close of C$67.96, the C$3.88 annual rate gave a yield of 5.7%. At the end of 2023 the yield was 7.44%.
What Enbridge does and how it makes money
Enbridge is a Calgary-based energy infrastructure company. Its pipelines earn tolls and its utilities earn regulated rates, so its results depend mainly on volumes, contracts and rate decisions rather than directly on oil and gas prices. It reports four business segments:
- Liquids Pipelines: crude oil and liquids pipelines, led by the Mainline system and including Line 9 and contracted capacity to the US Gulf Coast.
- Gas Transmission: long-distance natural gas pipelines, including Texas Eastern and East Tennessee in the United States.
- Gas Distribution and Storage: gas utilities that deliver to homes and businesses: Enbridge Gas Ontario and, since 2024, Enbridge Gas Ohio, Enbridge Gas Utah and Enbridge Gas North Carolina, bought from Dominion Energy in a C$19 billion acquisition completed during 2024.
- Renewable Power Generation: renewable power in North America and an offshore wind portfolio in Europe.
| Segment | Adjusted EBITDA 2025 (C$ m) | Adjusted EBITDA 2024 (C$ m) | Share of 2025 total |
|---|---|---|---|
| Liquids Pipelines | 9,710 | 9,654 | 48.7% |
| Gas Transmission | 5,397 | 4,782 | 27.0% |
| Gas Distribution and Storage | 4,139 | 2,869 | 20.7% |
| Renewable Power Generation | 672 | 820 | 3.4% |
| Eliminations and Other | 34 | 495 | 0.2% |
| Total | 19,952 | 18,620 |
Adjusted EBITDA is earnings before interest, tax, depreciation and amortization, adjusted by Enbridge for unusual or non-operating items; our guide to EBIT and EBITDA explains what it shows and hides. The table shows the effect of the utility purchase: Gas Distribution and Storage rose 44% in 2025, its first full year with all three US utilities. Liquids Pipelines still provides almost half of the total, so oil volumes on the Mainline matter, even though tolls rather than oil prices drive its revenue. Our energy sector guide explains how pipeline companies differ from producers.
Enbridge earnings: five years of results
Enbridge reports three main measures. GAAP earnings follow US accounting rules. Adjusted earnings remove items Enbridge considers unusual. DCF is a non-GAAP cash measure: in Enbridge's definition, cash from operating activities before changes in working capital, less distributions to minority partners, preferred share dividends and maintenance capital spending. Management says it uses DCF to set its dividend payout target.
| Year | Adjusted EBITDA (C$ m) | DCF (C$ m) | DCF per share | Adjusted EPS | GAAP EPS | Dividend per share | Dividend as % of DCF per share |
|---|---|---|---|---|---|---|---|
| 2021 | 14,001 | 10,041 | 4.96 | 2.74 | 2.87 | 3.34 | 67.3% |
| 2022 | 15,531 | 10,983 | 5.42 | 2.81 | 1.28 | 3.44 | 63.5% |
| 2023 | 16,454 | 11,267 | 5.48 | 2.79 | 2.84 | 3.55 | 64.8% |
| 2024 | 18,620 | 11,991 | 5.56 | 2.80 | 2.34 | 3.66 | 65.8% |
| 2025 | 19,952 | 12,454 | 5.71 | 3.02 | 3.23 | 3.77 | 66.0% |
DCF per share for 2021 and 2022 is as Enbridge reported it. For 2023 to 2025 it is our division of DCF by the weighted average share count Enbridge reports (2,056, 2,155 and 2,180 million shares), the same method that reproduces the 2021 and 2022 figures. The last column is our calculation.
What moved the numbers:
- 2022: GAAP EPS fell to C$1.28 because of a non-cash goodwill impairment of C$2.5 billion in the Gas Transmission reporting unit, which Enbridge attributed to a higher cost of capital. Adjusted EPS, which excludes the charge, rose to C$2.81.
- 2023: DCF per share rose only 1% as the share count grew. In September 2023 Enbridge sold 89.5 million new shares at C$44.70, raising C$4.0 billion before an over-allotment option, to help pay for the US utilities.
- 2024 and 2025: helped by the three US utilities, adjusted EBITDA rose 13% in 2024 and 7% in 2025, to a record C$19,952 million. DCF reached C$12,454 million in 2025, and Enbridge said it met or beat its financial guidance for the 20th year running.
Over the five years adjusted EBITDA rose 42.5% and DCF rose 24.0%, but DCF per share rose only 15.1%, because the weighted share count grew 7.8%, from 2,023 million to 2,180 million. That gap matters for the dividend, as the next sections show.
The latest quarter
In the third quarter of 2026, reported on 6 November 2026, adjusted EBITDA was C$4,434 million against C$4,267 million a year earlier, and DCF was C$2,689 million against C$2,566 million. GAAP EPS was C$0.59 against C$0.30, and adjusted EPS C$0.49 against C$0.46.
The segments moved in opposite directions. Liquids Pipelines fell C$101 million, which Enbridge put down to lower Mainline volumes, lower Mainline tolls on Line 9 deliveries and underused contracts to the US Gulf Coast. Gas Transmission rose C$165 million on rate settlements and increases at East Tennessee and Texas Eastern, and Gas Distribution and Storage rose C$105 million on new rates in Utah and North Carolina and growth in Ontario.
For the first nine months of 2026, adjusted EBITDA was C$15,020 million (up 1.9%), DCF C$9,488 million (up 2.6%), adjusted EPS C$2.10 against C$2.14, and GAAP EPS C$2.00 against C$2.34. Enbridge has filed its full-year results in mid-February in recent years: on 13 February 2026, 14 February 2025 and 9 February 2024.
Enbridge dividend history
| Year paid | Quarterly dividend (C$) | Annualized (C$) | Increase | Consecutive annual increase |
|---|---|---|---|---|
| 2019 | 0.738 | 2.952 | 10% | 24th |
| 2020 | 0.81 | 3.24 | 9.8% | 25th |
| 2021 | 0.835 | 3.34 | 3% | 26th |
| 2022 | 0.86 | 3.44 | 3% | 27th |
| 2023 | 0.8875 | 3.55 | 3.2% | 28th |
| 2024 | 0.915 | 3.66 | 3.1% | 29th |
| 2025 | 0.9425 | 3.77 | 3.0% | 30th |
| 2026 | 0.97 | 3.88 | 3% | 31st |
Enbridge raises the dividend once a year, announcing it in late November or early December with the next year's financial guidance and applying it from the 1 March payment. The announcements came on 11 December 2018, 10 December 2019, 8 December 2020, 7 December 2021, 29 November 2023, 3 December 2024 and 3 December 2025. As of 14 November 2026, Enbridge had not announced the 2027 rate or a date for its 2027 guidance.
The 31-year run counts years with an increase. Within each year the quarterly amount is the same for all four payments.
Why Enbridge's dividend growth slowed
Enbridge raised its dividend by 10% for 2019 and 9.8% for 2020, then switched to increases of about 3%. Its own statements explain the rule it now follows. In December 2021 it said it would grow the dividend "ratably" up to the level of its medium-term growth outlook for DCF per share, while aiming for the middle of a payout range of 60% to 70% of DCF. In December 2024 its chief executive said the financial guardrails of 4.5 to 5.0 times debt-to-EBITDA and a 60% to 70% DCF payout "remain firmly in place".
The numbers since 2021 fit that rule:
- DCF per share grew from C$4.96 in 2021 to C$5.71 in 2025, about 3.6% a year.
- The dividend grew from C$3.34 to C$3.77, about 3.1% a year.
- The payout stayed between 63% and 67% of DCF per share in every year.
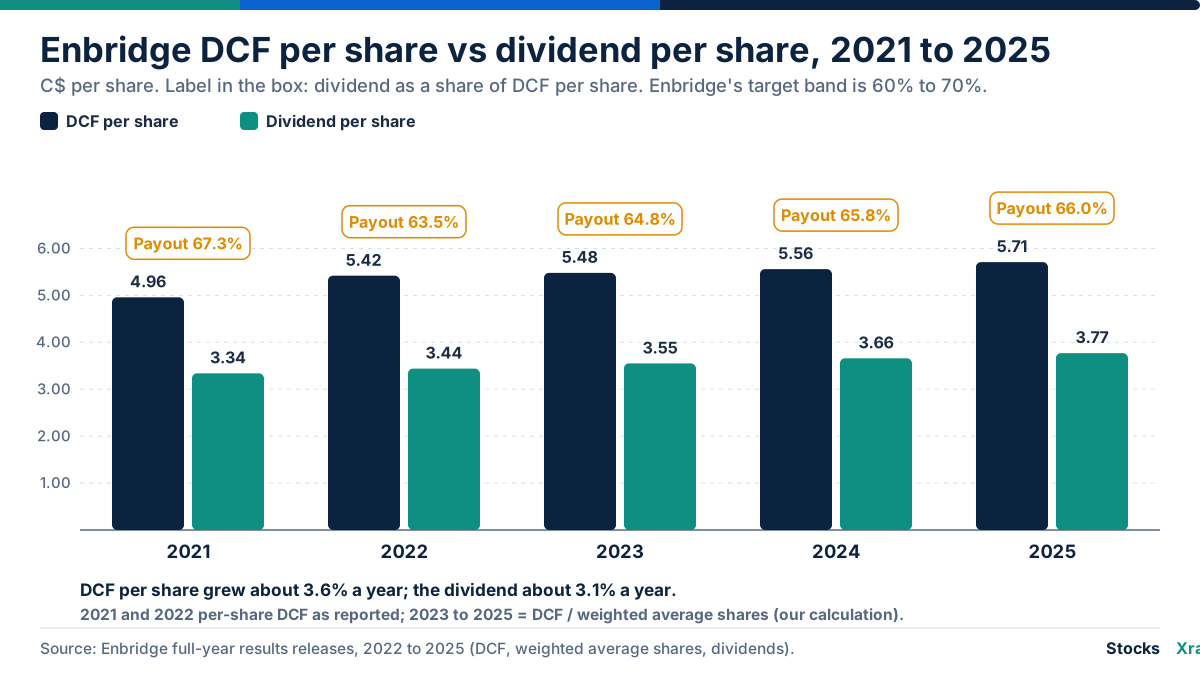
Two forces held DCF per share back. The first is dilution: Enbridge issued shares to help pay for the gas utilities, so DCF rose 24% from 2021 to 2025 while DCF per share rose 15%. The second is cost: interest expense was C$3,817 million in the first nine months of 2026 alone. With the payout already near the middle of its range, faster dividend growth would require faster growth in DCF per share, or a payout above the company's own band. For the general idea, see our dividend payout ratio guide and our post on dividend growth investing.
Worked example: from EBITDA to the dividend
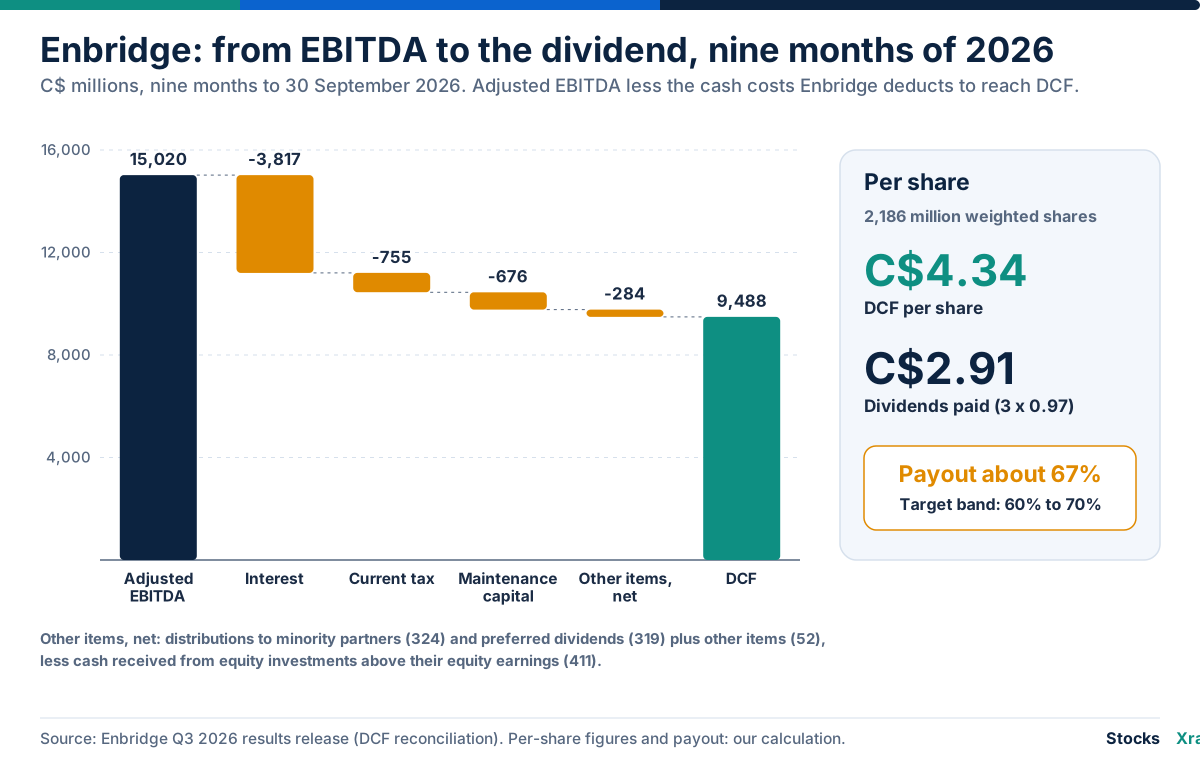
Enbridge's reconciliation for the nine months to 30 September 2026 shows how the cash that funds the dividend is built (C$ millions):
| Step | Amount |
|---|---|
| Adjusted EBITDA | 15,020 |
| Less interest expense | -3,817 |
| Less current income tax | -755 |
| Less maintenance capital | -676 |
| Plus cash distributions above equity earnings | 411 |
| Less distributions to minority interests | -324 |
| Less preferred share dividends | -319 |
| Less other items | -52 |
| DCF | 9,488 |
Taken together, the four lines between maintenance capital and DCF reduce it by a net C$284 million. Divided by 2,186 million weighted average shares, DCF was about C$4.34 per share. The three dividends paid in those nine months came to C$2.91 (three times C$0.97), a payout of about 67% (our calculation). Run the same arithmetic on earnings per share and the picture changes: in 2025 the C$3.77 dividend was 117% of GAAP EPS of C$3.23 and 125% of adjusted EPS of C$3.02. Pipelines carry large depreciation charges that reduce earnings but not cash, which is why Enbridge measures its payout against DCF.
Enbridge dividend dates and schedule
Enbridge pays four times a year, on 1 March, 1 June, 1 September and 1 December. The board declares each dividend four to five weeks before the payment, except the March payment, and names a record date in mid-February, mid-May, mid-August or mid-November, moved to a nearby business day when the 15th falls on a weekend. Since Canadian markets moved to one-day settlement on 27 May 2024, the ex-dividend date is the same day as the record date, so a buyer must purchase by the trading day before. Our guide to ex-dividend and record dates explains why.
| Announced | Ex-dividend and record date | Paid | Amount (C$) |
|---|---|---|---|
| 3 Dec 2025 | 17 Feb 2026 | 1 Mar 2026 | 0.97 |
| 6 May 2026 | 15 May 2026 | 1 Jun 2026 | 0.97 |
| 28 Jul 2026 | 14 Aug 2026 | 1 Sep 2026 | 0.97 |
| 3 Nov 2026 | 13 Nov 2026 | 1 Dec 2026 | 0.97 |
The March payment is declared with the annual increase in December; the others are announced in separate releases. Enbridge's release for the December 2026 payment was dated 4 November 2026 and its third-quarter report says the board declared it on 3 November. Upcoming ex-dividend dates for Enbridge and other stocks appear on our dividend calendar once announced.
Worked example (calculation from the dates above). An investor who bought 100 Enbridge shares on the Toronto Stock Exchange by 12 November 2026 was on the register on 13 November and will receive 100 times C$0.97, or C$97, on 1 December 2026. Over the four 2026 payments that is C$388. A holder who lives outside Canada would normally have Canadian withholding tax of 25% deducted, which a tax treaty can reduce; at the full rate the C$97 would arrive as C$72.75 (illustrative). Enbridge also trades on the New York Stock Exchange, but the dividend is declared in Canadian dollars, so its US-dollar value moves with the exchange rate shown on our CAD to USD converter.
Enbridge dividend yield
Dividend yield is the annual dividend divided by the share price. On the 13 November 2026 close of C$67.96, the 2026 rate of C$3.88 gave a yield of 5.7%.
| Date | Close (C$) | Dividends paid that year (C$) | Yield |
|---|---|---|---|
| End of 2021 | 49.41 | 3.34 | 6.76% |
| End of 2022 | 52.92 | 3.44 | 6.50% |
| End of 2023 | 47.70 | 3.55 | 7.44% |
| End of 2024 | 61.01 | 3.66 | 6.00% |
| End of 2025 | 65.68 | 3.77 | 5.74% |
| 13 Nov 2026 | 67.96 | 3.88 (2026 rate) | 5.71% |
The yield peaked at the end of 2023 when the share price was lowest, and fell as the price recovered. A high yield can reflect slower expected growth, higher debt or sensitivity to interest rates, so it needs reading alongside the payout and the balance sheet. Our dividend yield guide explains the high-yield trap, and our best dividend stocks list shows other income payers.
Valuation measures investors use for Enbridge
Because Enbridge pays out most of its cash and carries heavy depreciation charges, it is common to look at cash flow and EBITDA as well as earnings. Using the 13 November 2026 close of C$67.96 and Enbridge's 2025 results (our calculations):
| Measure | Value | What it compares |
|---|---|---|
| Dividend yield | 5.7% | The 2026 dividend rate with the share price |
| Price to 2025 DCF per share | 11.9 times | The share price with a year of distributable cash per share |
| Price to 2025 adjusted EPS | 22.5 times | The share price with a year of adjusted earnings |
| Debt-to-EBITDA, 30 Sep 2026 | 5.1 times | Enbridge's debt with 12 months of adjusted EBITDA (company figure) |
None of these is a verdict. A multiple only means something against the company's own history, its growth and the rates on offer elsewhere. Our guides to price to free cash flow and EV/EBITDA explain how to use them.
How StocksXray scores Enbridge
On the 13 November 2026 close, Enbridge's Market X-Ray score on our Enbridge stock page was 65 out of 100, ranking 232nd of 870 stocks on the Toronto Stock Exchange, with high confidence.
| Lens | Score (13 Nov 2026) | What it reflects |
|---|---|---|
| Trend | 44 | 5.0% below its 200-day average and 15.3% below its 52-week high |
| Momentum | 46 | Weaker 3-, 6- and 12-month returns than most TSX stocks |
| Stability | 86 | One-year volatility of 17.6% and a worst drawdown of 17.3% |
| Liquidity | 100 | Average daily trading value of about C$619 million |
| Income | 57 | A dividend yield of 5.7%, typical for TSX payers |
The Market X-Ray is price-based: it ranks how the shares have traded against other stocks on the same exchange and does not measure the health or value of the business. Fundamental lenses, described in how the X-Ray score works, are not yet available for Canadian stocks. For the current price, the interactive Enbridge chart and a printable Enbridge research report are on the stock page.
Balance sheet and cash flow
Enbridge is a heavy borrower, as pipeline and utility owners usually are. Its long-term debt, including the part due within a year, was C$104.4 billion at 31 December 2025, according to its annual report filed with the US Securities and Exchange Commission.
The company watches debt-to-EBITDA, the number of years of adjusted EBITDA its debt represents, and targets 4.5 to 5.0 times. The ratio was 4.1 times at the end of 2023, before the utility deals closed, 5.0 times at the end of 2024 and 4.8 times at the end of 2025. At 30 September 2026 it was 5.1 times, slightly above the range; Enbridge said this was because it translated its US-dollar debt at the quarter-end exchange rate of 1.42 Canadian dollars per US dollar, against an average of 1.39 for the EBITDA. Our net debt to EBITDA guide explains the ratio.
Cash provided by operating activities was C$12,270 million in 2025 against C$12,600 million in 2024. Enbridge also funds a large building program: it reported a secured growth backlog of about C$38 billion after placing C$3 billion of projects into service in the third quarter of 2026. Growth spending, interest and dividends all compete for the same cash, and rising interest rates raise the cost of refinancing.
Risks Enbridge lists
Enbridge's results releases list the risks that could make its outlook wrong. Five matter most for the dividend:
- Regulation and litigation: toll and rate decisions, permits and lawsuits. Line 5, which crosses Wisconsin and Michigan, is the best-known case: in July 2026 a US federal appeals court upheld a finding that the line trespasses on the Bad River Band's reservation in Wisconsin, while lifting a June 2026 shutdown deadline and asking the lower court to set a new timetable, according to press reports. Enbridge is building a reroute around the reservation.
- Interest rates and access to capital: higher rates raise interest costs and the cost of funding new projects.
- Supply and demand for energy: lower oil volumes cut Liquids Pipelines results in 2026, as the third quarter showed.
- Trade policy and politics: tariffs, sanctions, political decisions and public opinion, all named in Enbridge's own list.
- Dividend policy itself: Enbridge lists dividend policy among the risks and uncertainties attached to its forward-looking statements.
Exchange rates, inflation, weather and the renewal of rights-of-way also appear on the company's list.
Common mistakes when reading Enbridge's dividend
- Measuring the payout against earnings. The dividend has exceeded GAAP EPS, but Enbridge's target is 60% to 70% of DCF, which it has met each year since 2021.
- Looking only at total cash flow. DCF rose 24% from 2021 to 2025, but DCF per share rose 15%. The dividend follows the per-share figure.
- Using the old ex-dividend rule. Since 27 May 2024 the ex-dividend date in Canada falls on the record date, not a day before.
- Reading the 31-year streak as a promise. Each increase is a board decision, and Enbridge lists dividend policy among its risks.
- Mixing currencies. The dividend is set in Canadian dollars; US-dollar amounts change with the exchange rate.
Frequently asked questions
How much is Enbridge's dividend? Enbridge pays C$0.97 per common share each quarter in 2026, or C$3.88 a year. That was a 3% increase from C$0.9425 a quarter in 2025, declared on 3 December 2025 and effective with the 1 March 2026 payment.
When does Enbridge pay its dividend? Enbridge pays on 1 March, 1 June, 1 September and 1 December. The record dates fall in the middle of the month before each payment; in 2026 they were 17 February, 15 May, 14 August and 13 November.
What is the Enbridge ex-dividend date? For the dividend paid on 1 December 2026, the ex-dividend date and record date were both 13 November 2026, so a buyer needed to purchase by 12 November. Since May 2024 Canadian ex-dividend dates fall on the record date.
What is Enbridge's dividend yield? On 13 November 2026 the annual rate of C$3.88 and the close of C$67.96 gave a yield of 5.7%. At the end of 2023 the yield was 7.44%, and at the end of 2025 it was 5.74%. The yield moves every day with the share price.
How many years has Enbridge raised its dividend? The increase for 2026 was Enbridge's 31st consecutive annual dividend increase, according to the company. Since 2021 each increase has been about 3%.
Why has Enbridge's dividend growth slowed? Enbridge aims to pay 60% to 70% of its distributable cash flow and to grow the dividend in line with DCF per share. DCF per share grew about 3.6% a year from 2021 to 2025, held back partly by new shares issued to fund acquisitions, so dividend increases settled at about 3%.
When does Enbridge report earnings? Enbridge reported third-quarter 2026 results on 6 November 2026. It has filed full-year results in mid-February in recent years, on 13 February 2026, 14 February 2025 and 9 February 2024; as of 14 November 2026 we found no confirmed date for the full-year 2026 report.
Sources and data notes
- Enbridge results releases filed with the SEC: third quarter 2026, full year 2025, 2024, 2023 and 2022.
- Enbridge dividend and guidance releases: 3 December 2025, 3 December 2024, 7 December 2021, 8 December 2020, 10 December 2019, and the quarterly declarations of 6 May 2026 and 28 July 2026; the 1 December 2026 dividend is declared in the third-quarter 2026 release.
- Enbridge 2025 annual report on Form 10-K, debt figure via SEC XBRL data.
- Toronto Stock Exchange, T+1 trading notice; Canada Revenue Agency, rates for Part XIII tax; Madison365, report on the Line 5 appeals ruling, August 2026.
- Share prices, yields and Market X-Ray scores are StocksXray's own end-of-day records for the Toronto Stock Exchange, as of the 13 November 2026 close.
This page covers Enbridge's common-share dividend and results to the third quarter of 2026. It does not cover preference-share dividends, the company's forward guidance, or individual tax advice.
Educational information, not financial advice.
Related reading
Educational only, not financial advice. Examples use illustrative numbers.