









CBA Dividend History, Dates and Franking: How CommBank Pays Out
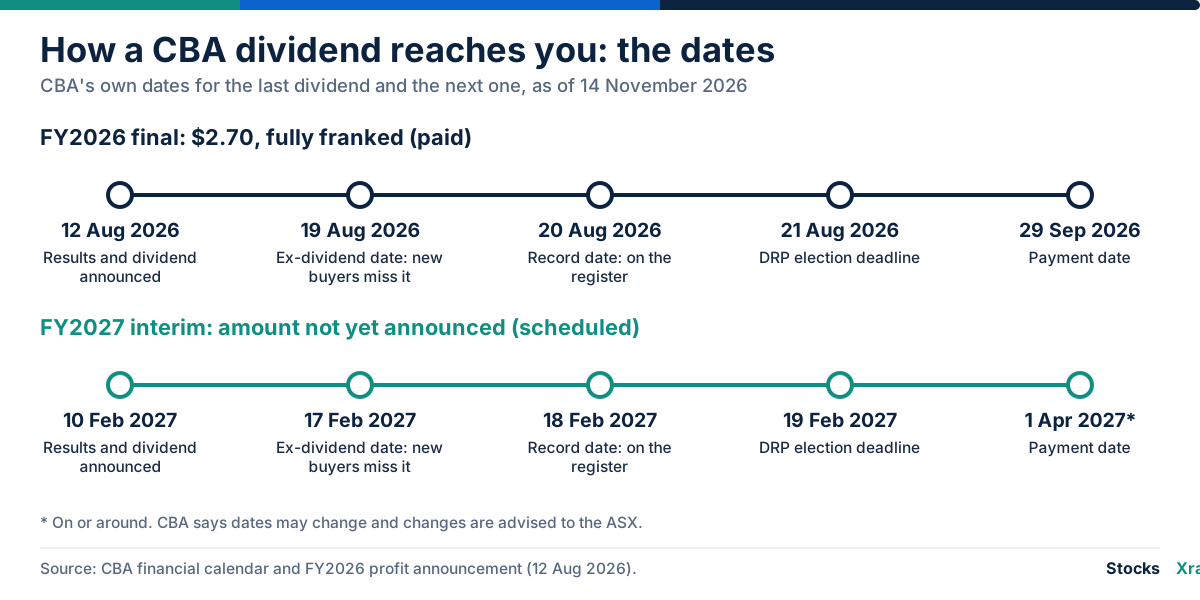
Commonwealth Bank of Australia (CBA) pays two fully franked dividends a year. For the year to 30 June 2026 (FY2026) it paid $5.05 a share: a $2.35 interim on 30 March 2026 and a $2.70 final on 29 September 2026, together 77% of cash profit. As of 14 November 2026, CBA's own calendar schedules the next interim for announcement on 10 February 2027, ex-dividend on 17 February and payment on or around 1 April 2027. This guide covers the history, the dates, the payout policy, franking credits and the results behind the dividend.
Key takeaways
- CBA's FY2026 dividend of $5.05 a share was 20 cents (4%) more than FY2025's $4.85 and the highest full-year total in the dividend history CBA publishes, which goes back to 1991.
- The policy is to pay 70% to 80% of cash net profit after tax (cash NPAT) over a full year, fully franked. FY2026 came in at 77%.
- As of 14 November 2026, CBA's calendar lists the FY2027 interim as announced on 10 February 2027, ex-dividend 17 February, record date 18 February and payment on or around 1 April 2027. The amount is not yet known.
- Dividends are franked at the 30% company tax rate, so each $1.00 of cash carries a franking credit of about $0.43. FY2026 dividends also carried a NZ$0.15 New Zealand imputation credit per share.
- The dividend is not guaranteed. In 2020 CBA cut its final to 98 cents after the bank regulator, APRA, limited bank payouts. It has risen every year since, from $3.50 in FY2021 to $5.05.
What CBA does and how it makes money
CBA says it is the main financial institution for one in three Australians and one in four Australian businesses. It reports five divisions. Their cash net profit after tax in FY2026 was:
| Division | What it covers | FY2026 cash NPAT (A$m) | FY2025 (A$m) |
|---|---|---|---|
| Retail Banking Services | Home loans, deposits, cards and personal loans for households | 5,587 | 5,330 |
| Business Banking | Lending, deposits and payments for small and mid-sized businesses | 4,544 | 4,092 |
| Institutional Banking and Markets | Large companies, governments and markets trading | 1,258 | 1,238 |
| New Zealand | ASB Bank | 1,112 | 1,195 |
| Corporate Centre and Other | Group-wide investment spend, remediation and minority investments | (1,519) | (1,603) |
| Group | 10,982 | 10,252 |
Most of the income is interest. Of $30.2 billion of total operating income on a cash basis in FY2026, $25.6 billion, about 85%, was net interest income: the interest CBA earns on loans and investments minus what it pays on deposits and borrowings. Its net interest margin, that gap as a share of average interest-earning assets, was 2.05%, down from 2.08% in FY2025.
Against that income, operating expenses were $13.8 billion, or 45.5% of income, and loan impairment expense, the provision for loans that may not be repaid, was $788 million, about 0.08% of average loans. What is left, after 30% corporate tax, funds the dividend. Our guide to the financials sector explains how bank earnings work in more detail.
CBA results, FY2022 to FY2026
"Cash NPAT" is CBA's main profit measure. It is statutory profit adjusted to remove hedging and accounting volatility and gains or losses from buying and selling businesses, and it is the figure the dividend policy uses.
| Year to 30 June | Operating income, cash (A$m) | Cash NPAT (A$m) | Statutory NPAT (A$m) | Cash EPS (cents) | Dividend (cents) | Payout, cash | Return on equity, cash |
|---|---|---|---|---|---|---|---|
| FY2022 | 24,599 | 9,514 | 10,690 | 552.4 | 385 | 68% | 12.6% |
| FY2023 | 27,135 | 10,072 | 9,998 | 596.1 | 450 | 75% | 13.9% |
| FY2024 | 27,174 | 9,836 | 9,394 | 587.8 | 465 | 79% | 13.6% |
| FY2025 | 28,465 | 10,252 | 10,116 | 613.2 | 485 | 79% | 13.5% |
| FY2026 | 30,224 | 10,982 | 10,866 | 656.9 | 505 | 77% | 14.0% |
Cash figures are for continuing operations. Statutory profit includes discontinued operations and the gains or losses that cash profit leaves out.
What moved the numbers:
- FY2022: Loan impairment was a net benefit of $357 million rather than a cost, and statutory profit included $955 million of gains from selling businesses.
- FY2023: Net interest income rose 18% to $23.1 billion and the net interest margin widened from 1.90% to 2.07%. Loan impairment expense was $1.1 billion.
- FY2024: The margin narrowed to 1.99% and cash profit fell 2% to $9.8 billion, yet the dividend still rose, taking the payout ratio to 79%.
- FY2025 and FY2026: Cash profit grew to $10.3 billion and then $11.0 billion. CBA said FY2026 was helped by lending volume growth and a broadly stable underlying margin, and held back by higher costs from inflation and technology and a larger loan impairment expense.
Return on equity, profit as a share of shareholders' capital, was 14.0% in FY2026. Our guide to return on equity explains why banks are often judged on it.
The latest quarter
CBA's trading update for the quarter to 30 September 2026, released on 11 November 2026, reported unaudited cash NPAT of about $2.8 billion, flat on the second-half quarterly average and 8% above the same quarter a year earlier. Its Common Equity Tier 1 (CET1) capital ratio was 11.5% after paying $4.5 billion of dividends during the quarter. CBA also said home loan application volumes were 16% lower than a year earlier. Trading updates do not include a dividend.
CBA dividend history
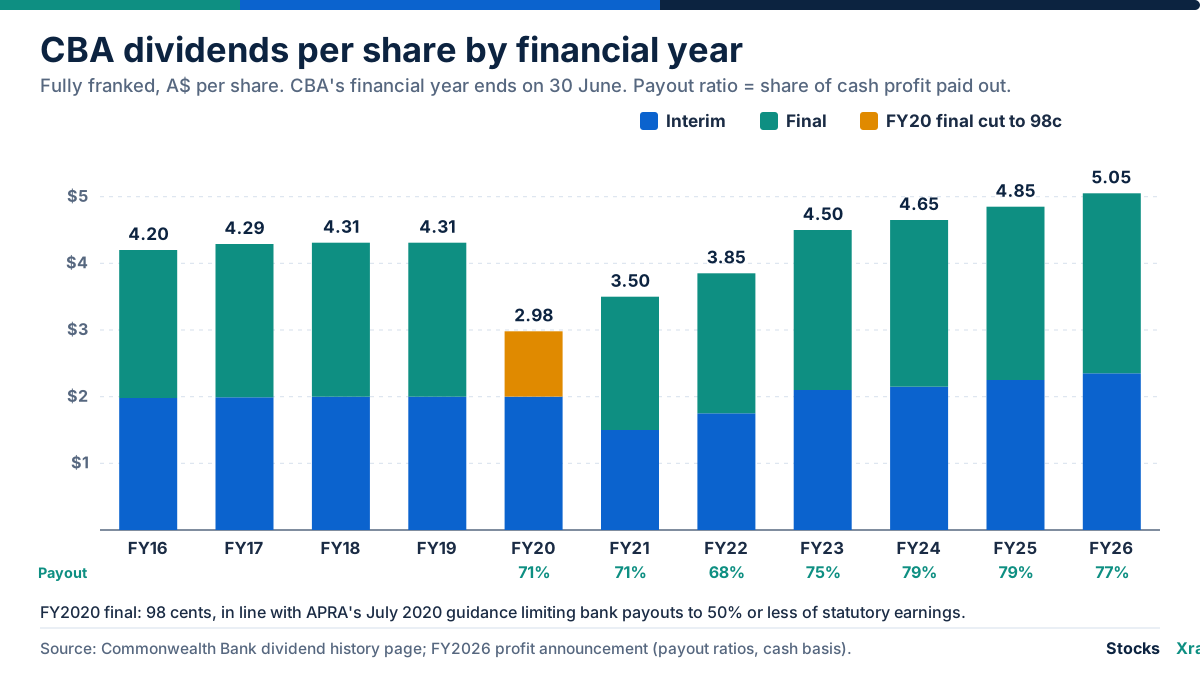
CBA's dividends have been fully franked in every half since its dividend history begins in 1991. The table shows the last 11 financial years, with the payment date of each dividend and the payout ratio on a cash basis where CBA publishes it.
| Financial year | Interim | Paid | Final | Paid | Total | Payout, cash |
|---|---|---|---|---|---|---|
| FY2016 | $1.98 | 31 Mar 2016 | $2.22 | 29 Sep 2016 | $4.20 | n/a |
| FY2017 | $1.99 | 4 Apr 2017 | $2.30 | 29 Sep 2017 | $4.29 | n/a |
| FY2018 | $2.00 | 28 Mar 2018 | $2.31 | 28 Sep 2018 | $4.31 | n/a |
| FY2019 | $2.00 | 28 Mar 2019 | $2.31 | 26 Sep 2019 | $4.31 | n/a |
| FY2020 | $2.00 | 31 Mar 2020 | $0.98 | 30 Sep 2020 | $2.98 | 71% |
| FY2021 | $1.50 | 30 Mar 2021 | $2.00 | 29 Sep 2021 | $3.50 | 71% |
| FY2022 | $1.75 | 30 Mar 2022 | $2.10 | 29 Sep 2022 | $3.85 | 68% |
| FY2023 | $2.10 | 30 Mar 2023 | $2.40 | 28 Sep 2023 | $4.50 | 75% |
| FY2024 | $2.15 | 28 Mar 2024 | $2.50 | 27 Sep 2024 | $4.65 | 79% |
| FY2025 | $2.25 | 28 Mar 2025 | $2.60 | 29 Sep 2025 | $4.85 | 79% |
| FY2026 | $2.35 | 30 Mar 2026 | $2.70 | 29 Sep 2026 | $5.05 | 77% |
Because CBA's year ends on 30 June, each calendar year contains the interim from one financial year and the final from another. The dividends paid in calendar 2025 were the $2.25 interim in March and the $2.60 final in September, $4.85 in total. In calendar 2026 they were $2.35 and $2.70, $5.05 in total.
The 2020 cut
The one sharp cut of the last decade came in August 2020, during the pandemic. CBA set its FY2020 final at 98 cents, against $2.31 a year earlier. The bank said the cut was in line with guidance the Australian Prudential Regulation Authority (APRA) issued at the end of July 2020, which limited bank payouts to 50% or less of statutory earnings. CBA's cash profit from continuing operations for FY2020 was $7.3 billion.
The episode shows two things. The regulator can limit bank dividends in a crisis, and CBA's payout follows profit and capital rather than a fixed dollar amount. The FY2021 interim was $1.50, below the $2.00 of the year before, before the dividend climbed back.
How fast the dividend has grown
Measured from FY2021, the first full year after the cut, growth looks fast: from $3.50 in FY2021 to $5.05 in FY2026 is a rise of 44%, or about 7.6% a year compounded. Measured from before the cut, it looks slower: FY2019's $4.31 to FY2026's $5.05 is 17% over seven years, about 2.3% a year. Both are correct, and the choice of starting year changes the story. Our guide to dividend growth investing explains why the base year matters when comparing payers.
CBA dividend dates and the next dividend
CBA announces its interim dividend with its half-year results in February and its final dividend with its full-year results in August, and publishes the dates in advance. The ex-dividend date is the first trading day on which a buyer of the shares does not get the coming dividend. The record date, the next business day, is when CBA checks its register.
| Dividend | Announced | Ex-dividend | Record date | DRP deadline | Payment |
|---|---|---|---|---|---|
| FY2025 interim ($2.25) | 12 Feb 2025 | 19 Feb 2025 | 20 Feb 2025 | 21 Feb 2025 | 28 Mar 2025 |
| FY2025 final ($2.60) | 13 Aug 2025 | 20 Aug 2025 | 21 Aug 2025 | 22 Aug 2025 | 29 Sep 2025 |
| FY2026 interim ($2.35) | 11 Feb 2026 | 18 Feb 2026 | 19 Feb 2026 | 20 Feb 2026 | 30 Mar 2026 |
| FY2026 final ($2.70) | 12 Aug 2026 | 19 Aug 2026 | 20 Aug 2026 | 21 Aug 2026 | 29 Sep 2026 |
| FY2027 interim (amount not yet set) | 10 Feb 2027 | 17 Feb 2027 | 18 Feb 2027 | 19 Feb 2027 | 1 Apr 2027 (on or around) |
| FY2027 final (amount not yet set) | 11 Aug 2027 | 18 Aug 2027 | 19 Aug 2027 | 20 Aug 2027 | 1 Oct 2027 (on or around) |
The 2027 dates are CBA's schedule as published on its financial calendar on 14 November 2026. CBA says dates may change and that any change will be announced to the ASX. Our explainer on ex-dividend and record dates covers how these dates work, and our dividend calendar lists upcoming ex-dates once they approach.
The dividend reinvestment plan
CBA's dividend reinvestment plan (DRP) lets shareholders take shares instead of cash. For the FY2026 final there was no discount, and CBA expected to buy the shares on market rather than issue new ones, which avoids diluting other holders. It did the same for the two previous dividends, the FY2025 final and FY2026 interim, when DRP participation rates were 14.8% and 13.5%. The DRP price for the FY2026 final was $156.45.
Franking credits on CBA dividends
A franking credit passes on to shareholders the 30% company tax CBA has already paid on the profits behind a dividend. CBA's FY2026 final was "fully franked (30%)", in the words of its annual report. The shareholder adds the credit to taxable income, which is called grossing up, and then subtracts the same amount from the tax bill.
Worked example: 100 shares and the $2.70 final
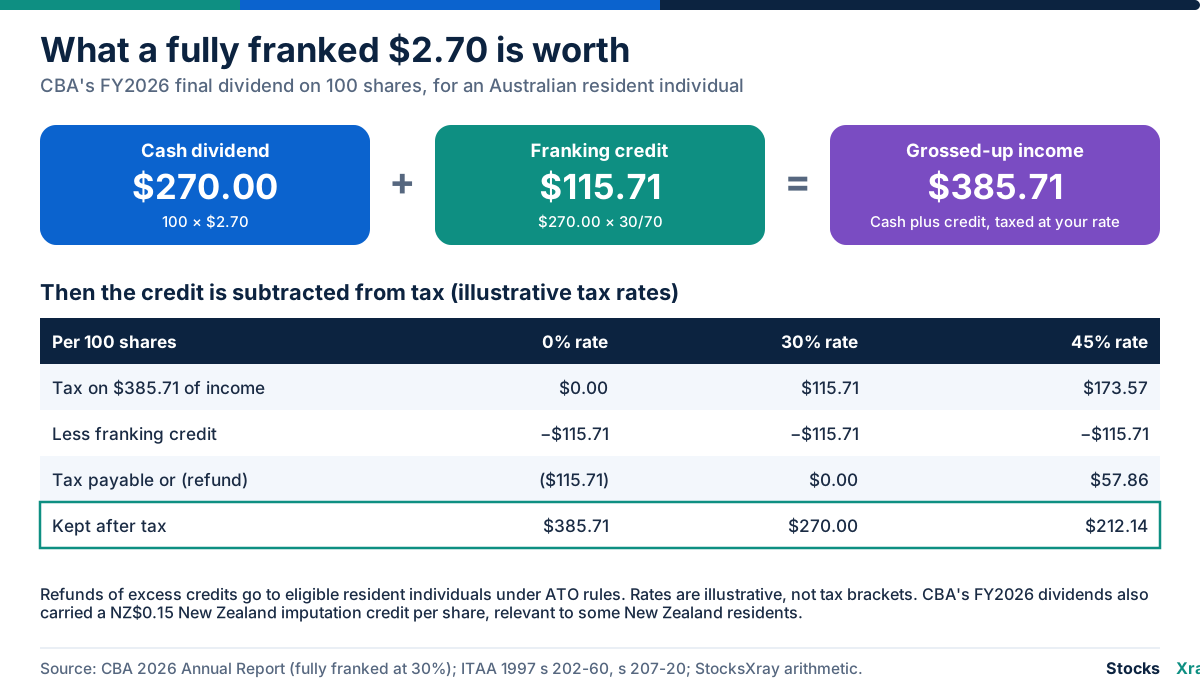
On 100 shares, the FY2026 final paid $270.00 in cash. The franking credit is the cash amount multiplied by 30/70, so $115.71. Grossed-up income is $385.71.
What happens next depends on the holder's tax rate. With illustrative rates, chosen to show the mechanics rather than any person's bracket:
- At 0%, there is no tax to pay, and the Australian Taxation Office (ATO) refunds excess credits to eligible resident individuals, so the holder keeps $385.71.
- At 30%, tax on $385.71 is $115.71, exactly cancelled by the credit, so the holder keeps $270.00.
- At 45%, tax is $173.57, the credit covers $115.71, and $57.86 is left to pay, so the holder keeps $212.14.
Holders outside Australia and in New Zealand
Franking credits belong to the Australian tax system; for shareholders abroad the main effect is on withholding tax. The ATO's guidance to companies says no withholding tax has to be deducted from fully franked dividends paid to foreign residents, so they receive the cash in full; their home country may tax it.
CBA's dividends also carry New Zealand imputation credits, NZ$0.15 a share on each FY2026 dividend, which CBA says are relevant to New Zealand resident taxpayers who meet certain conditions. CBA reported A$2,213 million of Australian franking credits and NZ$802 million of New Zealand imputation credits available at 30 June 2026, after allowing for tax payable on the year's profit.
The payout policy and the capital behind it
CBA's board sets the dividend by looking at three things, according to its annual report: paying cash dividends at sustainable levels, targeting a full-year payout ratio of 70% to 80% of cash NPAT, and using its franking credits in full by paying fully franked dividends. The board treats cash NPAT as its measure of organic capital generation.
The halves can sit outside the range while the full year stays inside it. The FY2026 interim was a 72% payout and the final 82%, giving 77% for the year. Dividend cover, cash profit divided by dividends, was 1.3 times. Our guide to the dividend payout ratio explains what that cushion means.
An illustrative way to see the link between profit and the dividend: CBA had about 1,672 million shares on average in FY2026. At a 75% payout, every $100 million of cash profit supports $75 million of dividends, or about 4.5 cents a share. A swing of $1 billion in cash profit, in either direction, would therefore move the full-year dividend by roughly 45 cents at an unchanged payout ratio.
For a bank, the main constraint on dividends is capital rather than free cash flow. At 30 June 2026 CBA's CET1 ratio, its core capital as a share of risk-weighted assets, was 12.0%, against APRA's minimum of 10.25%. Customer deposits supplied 79% of funding, and the liquidity coverage ratio was 132%. CBA did not extend a $1 billion on-market share buyback that expired on 12 August 2026 with $300 million completed; our guide to share buybacks explains how buybacks differ from dividends.
CBA dividend yield, with dates
Dividend yield is the last 12 months of dividends divided by the share price. CBA closed at A$170.87 on 13 November 2026. The $5.05 paid in the 12 months to then gives a cash yield of 3.0%. Adding franking credits, the grossed-up yield was 4.2%.
The yield moves with the share price every day, and it looks back, not forward. CBA has not announced its FY2027 dividends. Our explainer on dividend yield covers how to compare yields fairly, and our best dividend stocks list ranks income stocks across markets. For the current price, see the CBA stock page and the interactive chart. The ASX 200 page shows how the wider Australian market has moved.
How StocksXray scores CBA
On 13 November 2026 CBA had a Market X-Ray score of 80 out of 100, with high confidence. The Market X-Ray is price-based: it ranks how the share has traded against other stocks on the ASX. The five lenses read: trend 77, momentum 75, stability 93, liquidity 100 and income 42. The income lens looks at the cash dividend yield and the number of years with dividends, without franking, so a cash yield near 3% scores 42, below the middle of the ASX range.
The score says nothing about the bank's capital, credit quality or the safety of its dividend. Our fundamental X-Ray, built from financial statements, covers US stocks for now. The CBA stock page shows the latest score, and how the X-Ray Score works explains the method.
Risks CBA itself lists
CBA's 2026 Annual Report names the main themes in its operating environment and its material risks. Those that bear on the dividend:
- Rising macroeconomic uncertainty. Inflation, higher interest rates and a softer housing market add to cost-of-living pressure. In FY2026 home loan arrears rose to 0.73% and personal loan arrears to 1.72%, and loan impairment expense rose 9%.
- Credit risk. CBA lists losses from borrowers failing to repay, across home loans, personal lending and business and institutional lending, as a material risk. Larger impairments cut cash profit and therefore the dividend.
- Geopolitical risk. CBA says geopolitical tension raises risks around financial crime, cyber security and operational resilience and can make funding markets more volatile.
- Technology, AI, cyber, fraud and scams. Rapid technology change brings more sophisticated fraud and cyber threats; CBA said it invested more than $1 billion in FY2026 to protect customers from them.
- Trust, reputation and regulation. On 12 November 2026 CBA issued an ASX statement acknowledging civil penalty proceedings commenced by the Australian Securities and Investments Commission (ASIC). ASIC alleges that about 42,000 CommBiz business customers were overcharged about $8.5 million in fees between November 2020 and 31 May 2025. These are allegations, not findings of a court.
- Competition. Digital banks, non-bank lenders and global technology companies are competing in lending and payments.
Common mistakes when reading CBA's dividend
- Treating the grossed-up yield as cash. The 4.2% grossed-up yield includes franking credits, which only shareholders able to claim them under Australian tax rules receive in full.
- Buying on the ex-dividend date. Shares bought on or after the ex-dividend date do not carry the coming dividend.
- Mixing payout bases. CBA's FY2024 payout was 79% of cash profit but 83% of statutory profit. Compare like with like.
- Expecting a DRP discount. Recent DRPs had no discount and were filled with shares bought on market.
- Assuming the dividend cannot fall. The 2020 cut shows that profit and regulators set the limit.
- Assuming franking is automatic. The ATO's holding-period rule generally requires shares to be held at risk for at least 45 days, not counting the days of purchase and sale, unless the small shareholder exemption applies (total franking credits under $5,000 for the year).
Frequently asked questions
When is the next CBA dividend? CBA's financial calendar, as of 14 November 2026, schedules the FY2027 interim dividend to be announced with half-year results on 10 February 2027. The shares are due to go ex-dividend on 17 February 2027, with a record date of 18 February and payment on or around 1 April 2027. The amount will be set on 10 February.
What are the CBA dividend dates for 2026? The FY2026 interim of $2.35 went ex-dividend on 18 February 2026, had a record date of 19 February and was paid on 30 March 2026. The FY2026 final of $2.70 went ex-dividend on 19 August 2026, had a record date of 20 August and was paid on 29 September 2026.
How much was the CBA dividend in 2025? CBA paid $4.85 a share in calendar 2025: a $2.25 interim on 28 March 2025 (ex-dividend 19 February) and a $2.60 final on 29 September 2025 (ex-dividend 20 August). Both were fully franked and together made up the FY2025 dividend.
What is the CBA dividend yield? Based on the $5.05 paid in the 12 months to 13 November 2026 and that day's close of A$170.87, the cash yield was 3.0%, or 4.2% including franking credits. The yield changes with the share price and each new dividend.
Are CBA dividends fully franked? Yes. Every CBA dividend in its published history, back to 1991, has been fully franked, and its policy is to use its franking credits in full. Current dividends are franked at the 30% company tax rate, so each $1.00 of cash dividend carries a franking credit of about $0.43.
What is CBA's dividend payout ratio? CBA targets a full-year payout of 70% to 80% of cash NPAT. The FY2026 payout was 77% (72% for the interim and 82% for the final), and FY2024 and FY2025 were both 79%.
When are CBA's next results? CBA's half-year results for the six months to 31 December 2026 are scheduled for 10 February 2027 and its full-year results for 11 August 2027, according to its financial calendar as of 14 November 2026. Its last full-year results, for FY2026, were released on 12 August 2026.
Sources and data notes
- Commonwealth Bank, FY26 results ASX announcement and FY26 profit announcement, 12 August 2026.
- Commonwealth Bank, 2026 Annual Report (five-year financial summary, dividend note, operating context, risk management).
- Commonwealth Bank, dividend history and financial calendar, read on 14 November 2026.
- Commonwealth Bank, 1Q27 trading update, 11 November 2026, and FY2020 results overview, 12 August 2020.
- ASIC, media release 26-279MR.
- Income Tax Assessment Act 1997, sections 202-60 and 207-20, on legislation.gov.au; ATO guidance on franking tax offsets, refunds and withholding from dividends paid to foreign residents.
- Share price and Market X-Ray scores: StocksXray, close of 13 November 2026.
This guide covers CBA's dividends and results to 14 November 2026. It does not include dividend forecasts or personal tax advice; tax outcomes depend on your residence and circumstances.
Educational information, not financial advice.
Related reading
Educational only, not financial advice. Examples use illustrative numbers.