











Microsoft Earnings and Dividend: Results, Dividend History and Dates
Microsoft earned $133.7 billion on revenue of $331.8 billion in the fiscal year that ended on 30 June 2026, and diluted earnings per share rose 32% to $17.95, helped by gains on its OpenAI stake. In the September 2026 quarter revenue grew 19% to $92.3 billion. Microsoft reports four times a year, about four weeks after each quarter, and pays a quarterly dividend of $0.98 a share. This guide covers its earnings record from its filings, its businesses, report dates, and its dividend history, payout and yield.
Key takeaways
- In fiscal 2026 revenue rose 18% to $331.8 billion and operating income rose 21% to $155.2 billion. Net income rose 31% to $133.7 billion; excluding the OpenAI investment, Microsoft puts the rise at 22%.
- Azure passed $100 billion of annual revenue for the first time, at $101.9 billion, up 40%. The Microsoft Cloud as a whole brought in $214.4 billion, about 65% of revenue.
- Capital spending on cloud and AI infrastructure is reshaping the cash flow. Additions to property and equipment rose 80% to $115.9 billion in fiscal 2026, so free cash flow fell 6.5% to $67.0 billion even though cash from operations rose 34%.
- The quarterly dividend rose 8% to $0.98 in September 2026. The next payment is due on 10 December 2026 to shareholders of record on 19 November 2026, which is also the ex-dividend date.
- As of 14 November 2026 Microsoft had not announced the date of its next report. The December-quarter results came out on 28 January in 2026.
How Microsoft makes money
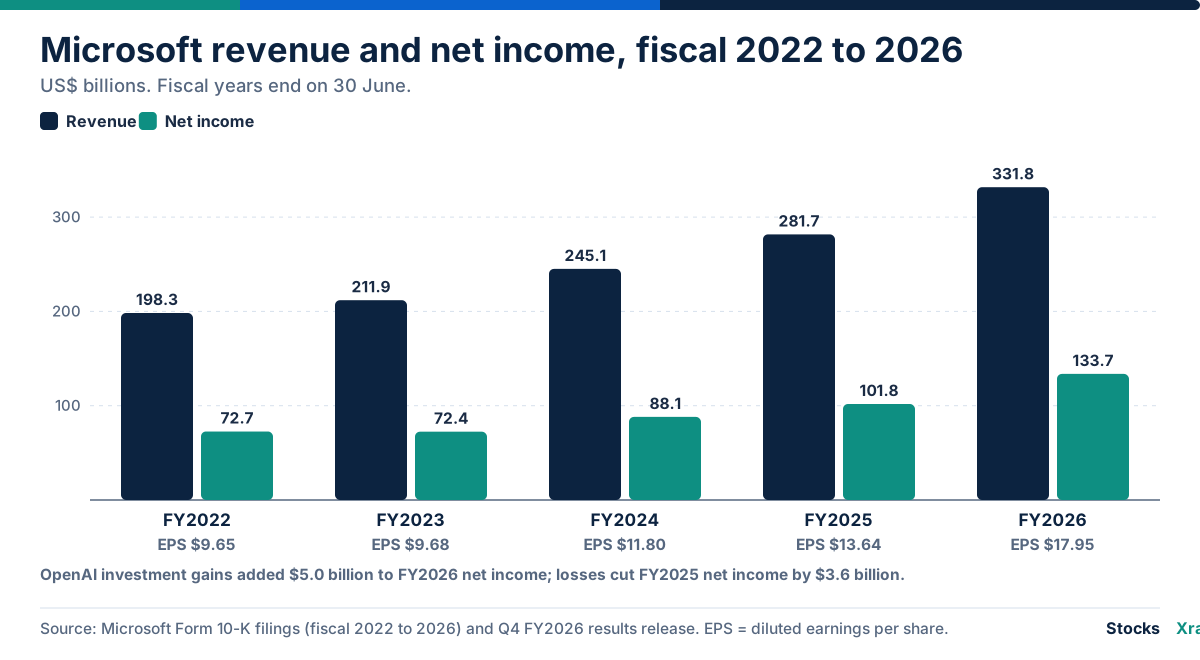
Microsoft sells cloud computing, software subscriptions and licenses, advertising, games and devices to businesses, governments and consumers. Its fiscal year ends on 30 June. From fiscal 2027 it reports two segments instead of three, a change announced in September 2026, and it has restated fiscal 2026 on the new basis:
- Agents and Infra brings together Azure, Microsoft 365 cloud (subscription productivity, developer and security apps, including Microsoft 365 and GitHub), Industry solutions (Dynamics 365, LinkedIn's talent and sales tools and healthcare cloud), traditional licenses for productivity and server software, and consulting and support. It produced $268.1 billion of revenue in fiscal 2026, 81% of the total, and $136.4 billion of operating income.
- Devices and Consumer holds Windows licenses sold through PC makers (OEMs) and Surface devices, XBOX, and search and advertising (Bing, Edge, MSN and LinkedIn marketing). It produced $63.7 billion of revenue, 19%, and $18.9 billion of operating income.
The old segments, Productivity and Business Processes, Intelligent Cloud and More Personal Computing, appear in reports up to fiscal 2026, so older articles and the fiscal 2026 10-K use different labels.
| Product or service line | Fiscal 2026 revenue | Share of total | Change vs fiscal 2025 |
|---|---|---|---|
| Azure | $101.9 billion | 30.7% | +40% |
| Microsoft 365 cloud | $100.3 billion | 30.2% | +19% |
| Productivity and server licensing | $37.3 billion | 11.2% | +5% |
| Search and advertising | $24.8 billion | 7.5% | +12% |
| XBOX | $21.8 billion | 6.6% | -7% |
| Industry solutions | $20.3 billion | 6.1% | +10% |
| Windows OEM and devices | $17.1 billion | 5.1% | -1% |
| Frontier and support services | $8.3 billion | 2.5% | +6% |
| Total | $331.8 billion | 100% | +18% |
The Microsoft Cloud, which combines Azure, Microsoft 365 commercial cloud and Industry solutions cloud, grew 27% to $214.4 billion. Its gross margin rate fell to 66%, which Microsoft attributes to continued investment in AI infrastructure and growing use of AI products. Revenue that Microsoft classifies to the United States was $170.8 billion, about 51.5% of the total.
Microsoft also reports commercial remaining performance obligation, the value of signed contracts not yet recognized as revenue. It stood at $678 billion on 30 June 2026, up 84%, and $677 billion on 30 September 2026. Our guide to deferred revenue explains how contracted revenue reaches the income statement.
Microsoft's earnings record over five fiscal years
| Fiscal year (to 30 June) | Revenue | Operating margin | Net income | Diluted EPS | Dividends declared per share |
|---|---|---|---|---|---|
| 2022 | $198.3 billion | 42.1% | $72.7 billion | $9.65 | $2.48 |
| 2023 | $211.9 billion | 41.8% | $72.4 billion | $9.68 | $2.72 |
| 2024 | $245.1 billion | 44.6% | $88.1 billion | $11.80 | $3.00 |
| 2025 | $281.7 billion | 45.6% | $101.8 billion | $13.64 | $3.32 |
| 2026 | $331.8 billion | 46.8% | $133.7 billion | $17.95 | $3.64 |
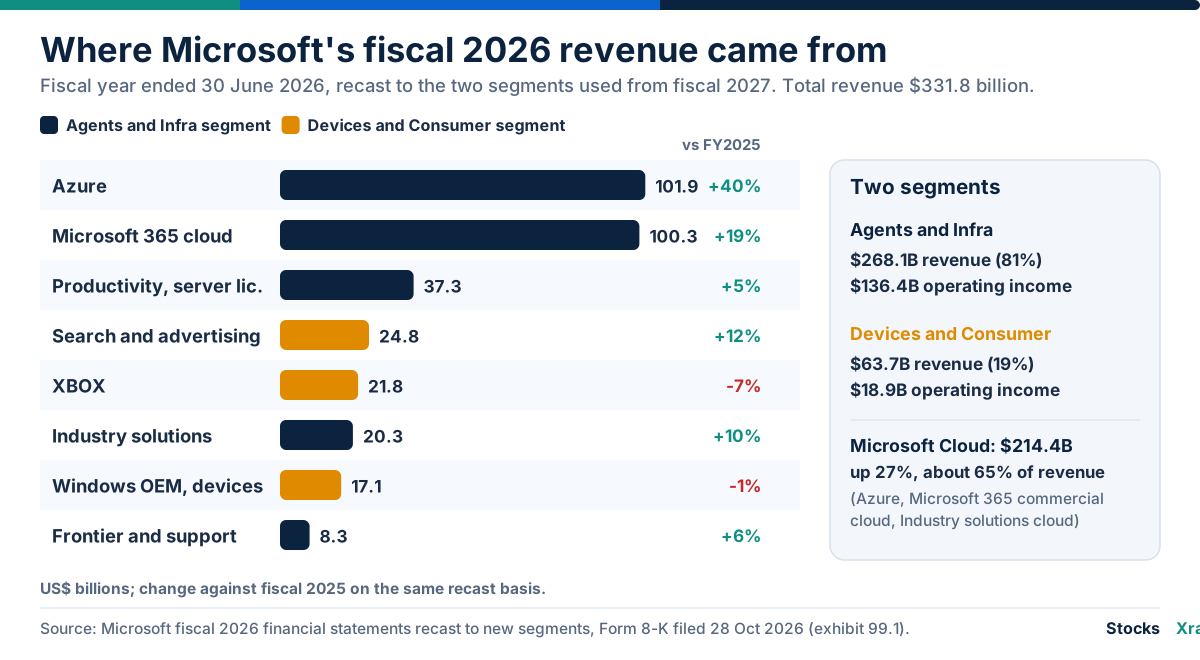
Revenue growth has picked up from 6.9% in fiscal 2023 to 15.7%, 14.9% and 17.8% in the three years since, and the operating margin, operating income as a share of revenue, has widened each year since 2023. Net income was flat in fiscal 2023 and has grown by at least 15% a year since.
Why GAAP and non-GAAP earnings differ
Microsoft's results releases now also show non-GAAP figures that strip out the impact of its investment in OpenAI. Gains and losses on that stake sit below operating income, so they move net income and EPS but not revenue or operating income. The swings have been large:
- In fiscal 2025 OpenAI-related losses cut net income by $3.6 billion and diluted EPS by $0.49.
- In fiscal 2026 net gains added $5.0 billion to net income and $0.67 to EPS. Most of it came in the December 2025 quarter, when gains added $7.6 billion. Under the agreement that accompanied OpenAI's recapitalization in October 2025, Microsoft said its stake was valued at about $135 billion, roughly 27% of OpenAI on an as-converted diluted basis.
On Microsoft's adjusted basis, fiscal 2026 EPS was $17.28, up 22% from $14.13, rather than the 32% rise in GAAP EPS. The adjustment covers only OpenAI: a $3.2 billion gain on Microsoft's investment in Anthropic in the June 2026 quarter stays in both sets of figures. Our guide to basic and diluted EPS explains how the per-share figure is built, and operating cash flow versus net income shows another way to test reported profit.
The latest five quarters
| Quarter (period end) | Reported | Revenue | Change | Net income | Diluted EPS | EPS excluding OpenAI |
|---|---|---|---|---|---|---|
| Q1 FY2026 (30 Sep 2025) | 29 Oct 2025 | $77.7 billion | +18% | $27.7 billion | $3.72 | $4.13 |
| Q2 FY2026 (31 Dec 2025) | 28 Jan 2026 | $81.3 billion | +17% | $38.5 billion | $5.16 | $4.14 |
| Q3 FY2026 (31 Mar 2026) | 29 Apr 2026 | $82.9 billion | +18% | $31.8 billion | $4.27 | $4.27 |
| Q4 FY2026 (30 Jun 2026) | 29 Jul 2026 | $90.0 billion | +18% | $35.8 billion | $4.81 | $4.74 |
| Q1 FY2027 (30 Sep 2026) | 28 Oct 2026 | $92.3 billion | +19% | $36.6 billion | $4.92 | $4.89 |
Changes are against the same quarter a year earlier.
The September 2026 quarter, the first reported under the new segments, showed revenue in Agents and Infra up 25% to $76.8 billion and Devices and Consumer down 3% to $15.5 billion. Azure revenue rose 48% under its new, narrower definition, the Microsoft Cloud rose 30% to $63.9 billion, and Windows OEM and devices revenue fell 22%. Operating income rose 21% to $45.9 billion.
Other milestones from the year, in Microsoft's own words: its AI business passed an annual revenue run rate of $37 billion in the March 2026 quarter, and Microsoft 365 Copilot had more than 30 million paid seats by the end of fiscal 2026.
When Microsoft reports earnings
Microsoft's fiscal quarters end on 30 September, 31 December, 31 March and 30 June. It reports about four weeks later, in late October, late January, late April and late July. In the past year the reports came on 29 October 2025, 28 January 2026, 29 April 2026, 29 July 2026 and 28 October 2026.
On results day Microsoft issues a press release, files it on Form 8-K, and files the full quarterly report (10-Q) or annual report (10-K) the same day. Executives host a conference call and webcast at 2:30 p.m. Pacific time (5:30 p.m. Eastern), after the US market closes, at microsoft.com/en-us/investor; the webcast stays available for a year. The release contains no outlook; Microsoft says it gives forward-looking guidance on the call. Our guide to earnings season and guidance explains why the guidance often moves the shares more than the results, and how to read a 10-K covers the annual report.
As of 14 November 2026 Microsoft had not announced the date for its December-quarter (second fiscal quarter of 2027) report in the sources we checked. Our Microsoft stock page shows the last six quarters of results and each recent dividend with its ex-dividend date.
Microsoft's dividend: history, dates and payout
Microsoft's dividend record since 2003
Microsoft pays a dividend every quarter. It declared its first annual dividend, $0.08 a share, in January 2003, and in July 2004 moved to quarterly payments of $0.08 together with a one-time special dividend of $3 a share. The quarterly dividend is now $0.98. Dividends declared per share have risen every fiscal year from 2014, when they totaled $1.12, to fiscal 2026, when they totaled $3.64.
Microsoft raises its dividend once a year, in mid-September, which falls in the first quarter of its fiscal year. So each fiscal year's total is normally four times the new September rate.
| Fiscal year | Quarterly dividend | Declared for the year | September raise |
|---|---|---|---|
| 2020 | $0.51 | $2.04 | 10.9% |
| 2021 | $0.56 | $2.24 | 9.8% |
| 2022 | $0.62 | $2.48 | 10.7% |
| 2023 | $0.68 | $2.72 | 9.7% |
| 2024 | $0.75 | $3.00 | 10.3% |
| 2025 | $0.83 | $3.32 | 10.7% |
| 2026 | $0.91 | $3.64 | 9.6% |
| 2027 (first quarter) | $0.98 | $0.98 so far | 7.7% |
Microsoft described the September 2026 increase as 7 cents, or 8%, the smallest percentage raise in the table.
Microsoft dividend dates
Microsoft declares a dividend in mid-September, early December and around 10 March and 10 June, sets a record date roughly ten weeks later and pays about three weeks after that.
| Declared | Record and ex-dividend date | Paid | Amount |
|---|---|---|---|
| 15 Sep 2025 | 20 Nov 2025 | 11 Dec 2025 | $0.91 |
| 2 Dec 2025 | 19 Feb 2026 | 12 Mar 2026 | $0.91 |
| 10 Mar 2026 | 21 May 2026 | 11 Jun 2026 | $0.91 |
| 10 Jun 2026 | 20 Aug 2026 | 10 Sep 2026 | $0.91 |
| 15 Sep 2026 | 19 Nov 2026 | 10 Dec 2026 | $0.98 |
Microsoft's announcements now give the ex-dividend date as the record date. That follows from the one-day (T+1) settlement cycle the US adopted on 28 May 2024: FINRA's rules set the ex-date on the record date when it is a business day. To receive the December 2026 payment an investor had to own the shares before 19 November 2026. Our guide to ex-dividend and record dates explains the timeline, and the dividend calendar lists upcoming dates for US stocks.
Payout ratio, yield and buybacks
Microsoft's dividend takes a modest share of profit. Dividends declared of $3.64 a share in fiscal 2026 were 20.3% of diluted EPS of $17.95, or 21.1% of EPS excluding OpenAI. Measured against cash, the picture has changed: the $26.4 billion paid in dividends was about 39% of free cash flow in fiscal 2026, against 28% in fiscal 2022, because capital spending has absorbed more of the cash. Our article on the dividend payout ratio explains both versions.
At the current rate of $0.98 a quarter, or $3.92 a year, and the closing price of $523.88 on 13 November 2026, the dividend yield was about 0.75%. Our explainer on dividend yield covers why a fast-growing dividend can come with a low yield, and our best dividend stocks list ranks S&P 500 payers yielding between 2% and 8%.
Microsoft's annual report says it intends to keep returning capital through dividends, subject to declaration by its board. It also buys back stock under a $60 billion program approved on 16 September 2024, of which $40.6 billion remained on 30 June 2026. In fiscal 2026 it repurchased 36 million shares for $16.7 billion under the program, and shares outstanding were roughly unchanged at 7.43 billion because 29 million newly issued shares offset most of the buybacks. Our guide to share buybacks explains why that matters.
Price to earnings, worked through with Microsoft's figures
The price-to-earnings ratio divides the share price by earnings per share over the last four reported quarters. It is a common way to compare how much investors pay for a dollar of profit, and the OpenAI adjustment shows why the EPS figure used matters.
Worked example. The four quarters to 30 September 2026 produced GAAP diluted EPS of $5.16 + $4.27 + $4.81 + $4.92 = $19.16. Excluding OpenAI, the same quarters give $4.14 + $4.27 + $4.74 + $4.89 = $18.04. With the shares at $523.88 at the close on 13 November 2026:
| Earnings measure | Last four quarters | Price-to-earnings ratio on 13 Nov 2026 |
|---|---|---|
| GAAP diluted EPS | $19.16 | 27.3 |
| EPS excluding OpenAI | $18.04 | 29.0 |
The two ratios differ by almost two points, mainly because of the OpenAI gains in the December 2025 quarter. Neither number says whether the shares are cheap or expensive on its own; that needs comparison with growth, peers and the company's own history, as our guide to the price-to-earnings ratio explains.
Cash flow, capital spending and the balance sheet
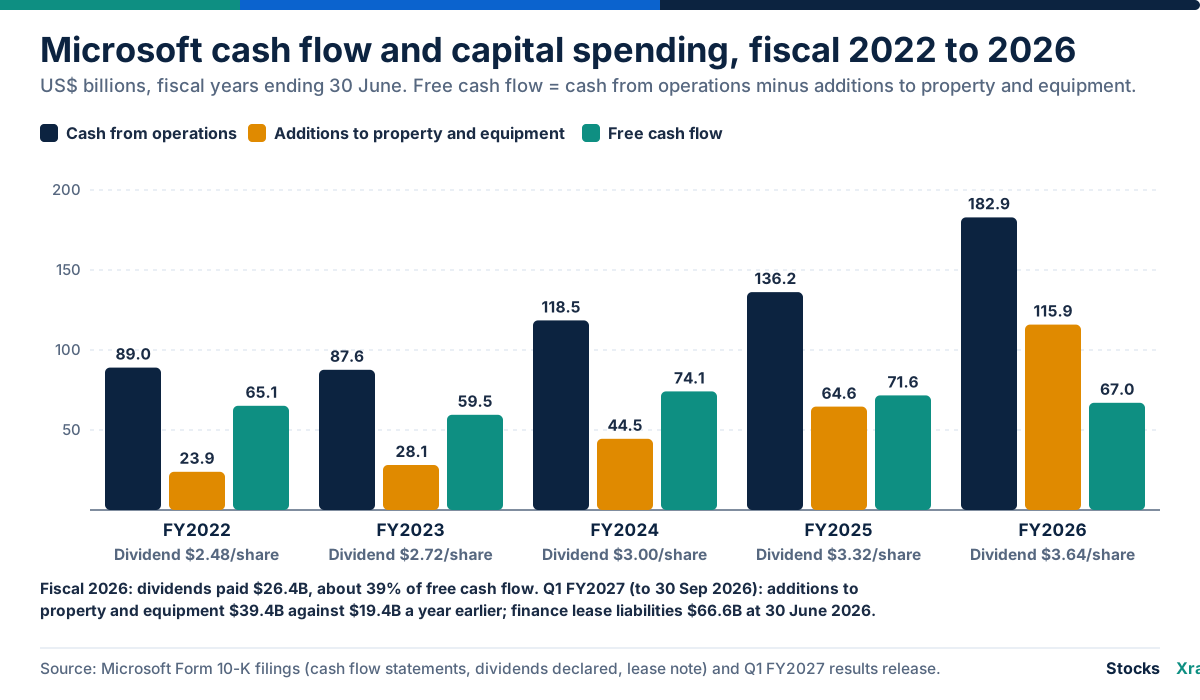
Microsoft's operations generate cash fast, and most of it now goes back into property and equipment for its cloud and AI infrastructure. Cash from operations rose from $89.0 billion in fiscal 2022 to $182.9 billion in fiscal 2026. Over the same years additions to property and equipment, which include datacenters and computer systems, rose from $23.9 billion, 12% of revenue, to $115.9 billion, 35% of revenue. Free cash flow, cash from operations minus that spending, was therefore no higher in fiscal 2026 ($67.0 billion) than in fiscal 2022 ($65.1 billion). The pace kept rising in the September 2026 quarter: $39.4 billion of additions, against $19.4 billion a year earlier. Our guides to capital expenditure and free cash flow explain the terms.
| Fiscal year | Cash from operations | Additions to property and equipment | Free cash flow | Dividends paid |
|---|---|---|---|---|
| 2022 | $89.0 billion | $23.9 billion | $65.1 billion | $18.1 billion |
| 2023 | $87.6 billion | $28.1 billion | $59.5 billion | $19.8 billion |
| 2024 | $118.5 billion | $44.5 billion | $74.1 billion | $21.8 billion |
| 2025 | $136.2 billion | $64.6 billion | $71.6 billion | $24.1 billion |
| 2026 | $182.9 billion | $115.9 billion | $67.0 billion | $26.4 billion |
Leases are the other part of the build-out. On 30 June 2026 Microsoft carried $66.6 billion of finance lease liabilities and $21.9 billion of operating lease liabilities, for datacenters and related infrastructure, servers, offices and other facilities. It had also signed further leases, primarily for datacenters, worth $329.1 billion that had not yet started and are due to begin between fiscal 2027 and fiscal 2033.
Conventional debt is small by comparison. On 30 June 2026 Microsoft held $76.8 billion of cash and short-term investments against $40.3 billion of debt; on 30 September 2026 the figures were $64.5 billion and $35.5 billion. On 4 November 2026 it issued $25 billion of new notes with maturities from 2028 to 2066. Stockholders' equity was $470.5 billion at the end of September 2026.
How StocksXray scores Microsoft
On 13 November 2026 Microsoft had a StocksXray X-Ray Score of 58 out of 100, with high confidence. Each of the five lenses is scored from 0 to 100 against other stocks in the information technology sector:
| Lens | Score on 13 Nov 2026 |
|---|---|
| Valuation | 47 |
| Growth | 61 |
| Profitability | 69 |
| Financial health | 61 |
| Dividends | 45 |
Profitability is the strongest lens. Dividends score lowest: the yield is small next to the sector median, although the payment has grown about 10% a year. Read the five lenses and how the X-Ray Score works for the method, and check the Microsoft stock page for the current score, which changes with prices and new filings.
For the share price itself, use the interactive Microsoft chart. The Microsoft research report gathers valuation history, our fair-value models and a fundamentals checklist, the Microsoft forecast page shows probability ranges built from past price moves rather than targets, and the Microsoft stock split page lists its eight splits since 1990; the last was in February 2003.
Company developments in 2026
- New segments. Announced on 2 September 2026 and used from the September 2026 quarter, with fiscal 2026 restated in a filing on 28 October 2026.
- AI partners. The OpenAI agreement signed in October 2025 keeps OpenAI as Microsoft's frontier model partner and extends Microsoft's rights to OpenAI models and products through 2032; revenue-sharing payments continue. The June 2026 quarter included the $3.2 billion Anthropic gain.
- Dividend and debt. The 8% dividend increase was declared on 15 September 2026, and $25 billion of notes were issued on 4 November 2026.
- Governance. The annual shareholders meeting is set for 8 December 2026, online. Director Emma Walmsley told the company on 4 November 2026 that she will not stand for re-election.
Risks Microsoft lists in its annual report
The fiscal 2026 Form 10-K describes many risks. Five weigh most on its earnings:
- Competition. Microsoft faces strong competitors in every market, including AI products from other cloud providers and newer business models, and must keep winning adoption of its cloud and AI services at prices that reflect their value.
- Returns on heavy investment. It says its large investments in AI products and infrastructure may not achieve the expected returns, because commercial success depends on customer demand, technology and competition.
- Infrastructure and power. Datacenter expansion depends on power, components and third-party facilities. Limits on electricity supply, delays in grid connections or outages could restrict capacity or disrupt services.
- Strategic partners. Partners such as AI model developers can change their priorities or purchasing, and some are significant Azure customers, so the expected consumption and benefits may not materialize.
- Security, regulation and legal claims. Cyberattacks, data-privacy rules, scrutiny of AI, competition law, tax and litigation can all raise costs or limit how Microsoft runs its business.
Common mistakes when reading Microsoft's results
- Mixing fiscal and calendar years. Microsoft's fiscal 2027 began on 1 July 2026; "Q1 FY2027" is July to September 2026.
- Comparing old and new segment names. Intelligent Cloud figures cannot be lined up against Agents and Infra figures; use the restated numbers.
- Treating OpenAI gains as operating profit. They come and go with the value of the stake, so check the figures excluding OpenAI next to the GAAP ones.
- Reading rising cash from operations as rising free cash. Capital spending has grown faster, and lease commitments add more spending outside capex.
- Assuming the raise is always about 10%. The September 2026 increase was 8%.
Frequently asked questions
When does Microsoft report earnings? Microsoft reports about four weeks after each fiscal quarter ends, in late January, April, July and October, and holds a call at 2:30 p.m. Pacific time on results day. The latest report, for the quarter to 30 September 2026, came out on 28 October 2026. As of 14 November 2026 the next date had not been announced.
Does Microsoft pay dividends? Yes. Microsoft pays a quarterly cash dividend, currently $0.98 a share after an 8% increase declared in September 2026. It declared its first dividend in 2003, has paid quarterly since 2004 and has raised the payment every September in recent years.
What is Microsoft's dividend yield? Dividend yield is the annual dividend divided by the share price. At $3.92 a year (four payments of $0.98) and the closing price of $523.88 on 13 November 2026, the yield was about 0.75%. It changes daily with the share price; the Microsoft stock page shows the current figure.
When is Microsoft's next dividend date? The next dividend of $0.98 a share is payable on 10 December 2026 to shareholders of record on 19 November 2026, which is also the ex-dividend date. The following dividend would normally be declared in early December, but Microsoft had not announced it as of 14 November 2026.
Why are Microsoft's GAAP and non-GAAP earnings different? Microsoft's non-GAAP figures exclude gains and losses on its investment in OpenAI. In fiscal 2026 those gains added $5.0 billion to net income, so GAAP diluted EPS was $17.95 against $17.28 excluding OpenAI. In fiscal 2025 losses cut EPS by $0.49.
What is Microsoft's price-to-earnings ratio? Using GAAP diluted EPS of $19.16 for the four quarters to 30 September 2026 and the $523.88 close on 13 November 2026, the price-to-earnings ratio was about 27.3. Using EPS excluding OpenAI, $18.04, it was about 29.0. Both change with the share price and each new quarter.
Sources and data notes
- Microsoft Form 10-K for fiscal 2026, filed 29 July 2026, and earlier 10-K filings for fiscal 2022 to 2025: SEC EDGAR, Microsoft filings.
- Microsoft Form 8-K of 28 October 2026 with fiscal 2026 statements recast to the new segments; Form 8-K of 2 September 2026 (segment presentation); Q1 FY2027 Form 10-Q.
- Microsoft results press releases (Form 8-K, exhibit 99.1) of 29 October 2025, 28 January, 29 April, 29 July and 28 October 2026; Microsoft corporate blog on the OpenAI agreement, 28 October 2025 (Form 8-K exhibit 99.2).
- Microsoft dividend announcements of 2 December 2025 and 15 September 2026; Microsoft dividends and stock history; Microsoft 2003 annual report and 20 July 2004 announcement for early dividend history.
- Microsoft Form 8-K filings of 4 November 2026 (notes) and 5 November 2026 (director).
- FINRA Regulatory Notice 24-04 and the SEC announcement of T+1 settlement.
- Share price and X-Ray scores: StocksXray data as of the 13 November 2026 close.
This article covers reported results to the September 2026 quarter and company announcements to 14 November 2026. It does not include outlooks, analyst estimates or price targets.
Educational information, not financial advice.
Related reading
Stocks in this article
Educational only, not financial advice. Examples use illustrative numbers.